Imagine I have a set of ten observations* (the original data has more digits):
      x    y
1  1.66 3.64
2  5.30 4.91
3  4.75 5.32
4  2.07 1.58
5  2.88 4.25
6  3.53 4.59
7  1.75 2.37
8  1.42 2.10
9  2.82 4.35
10 1.81 3.90
and I want to bootstrap the correlation to try to assess how stable (or how uncertain or how 'variable') the sample correlation is.
*(ten is much too few for the bootstrap to be much use, but this is just for illustration)
The idea is to resample the data - by sampling rows (with replacement) from the original data to obtain new pseudo-samples of size 10.
This is very easy with the boot package - most of the work is in writing a function for 'boot' to call.
With the above data in mydata:
> print(head(mydata,3),digits=3)
     x    y
1 1.66 3.64
2 5.30 4.91
3 4.75 5.32
...
you can do this in R as follows (following the help on boot):
mycor <- function(x,ind) cor(x[ind,])[1,2]  # this is how 'boot' needs it to work
bcor <- boot(mydata,mycor,R=999)
str(bcor) # to look at what you get back
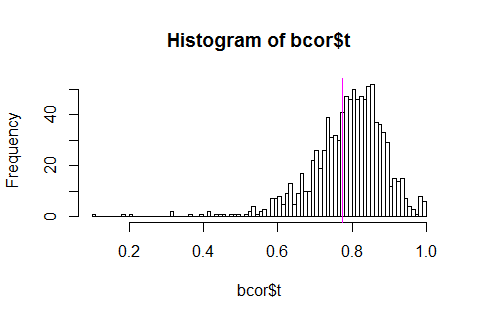
hist(bcor$t,n=100)

abline(v=bcor$t0,col=6)
producing:

The magenta line is the original sample correlation.


bootpackage goes with. Are you confusing the terms 'observation' (a data point for a single observational unit, like a person - possibly with observations on several variables) with 'sample' (a collection of such observations)? Please note that when you resample with the bootstrap you take your pseudo-samples of size $n$; in the notation of the function, you takeRsuch samples. You don't need to specify $n$ because it can see how big the original is. $\endgroup$