29
$\begingroup$

I have a data.frame with 800 obs. of 40 variables, and would like to use Principal Component Analysis to improve the results of my prediction (which so far is working best with Support Vector Machine on some 15 hand-picked variables).

I understand a prcomp can help me improve my predictions, but I do not know how to use the results of the prcomp function.

I obtain the result:

> PCAAnalysis <- prcomp(TrainTrainingData, scale.=TRUE)
> summary(PCAAnalysis)
Importance of components:
                          PC1    PC2    PC3    PC4    PC5   PC6    PC7    PC8    PC9   PC10   PC11   PC12   PC13   PC14
Standard deviation     1.7231 1.5802 1.3358 1.2542 1.1899 1.166 1.1249 1.1082 1.0888 1.0863 1.0805 1.0679 1.0568 1.0520
Proportion of Variance 0.0742 0.0624 0.0446 0.0393 0.0354 0.034 0.0316 0.0307 0.0296 0.0295 0.0292 0.0285 0.0279 0.0277
Cumulative Proportion  0.0742 0.1367 0.1813 0.2206 0.2560 0.290 0.3216 0.3523 0.3820 0.4115 0.4407 0.4692 0.4971 0.5248
                         PC15   PC16   PC17   PC18  PC19   PC20   PC21   PC22   PC23   PC24   PC25   PC26   PC27   PC28
Standard deviation     1.0419 1.0283 1.0170 1.0071 1.001 0.9923 0.9819 0.9691 0.9635 0.9451 0.9427 0.9238 0.9111 0.9073
Proportion of Variance 0.0271 0.0264 0.0259 0.0254 0.025 0.0246 0.0241 0.0235 0.0232 0.0223 0.0222 0.0213 0.0208 0.0206
Cumulative Proportion  0.5519 0.5783 0.6042 0.6296 0.655 0.6792 0.7033 0.7268 0.7500 0.7723 0.7945 0.8159 0.8366 0.8572
                         PC29   PC30   PC31   PC32   PC33   PC34   PC35   PC36    PC37                 PC38
Standard deviation     0.8961 0.8825 0.8759 0.8617 0.8325 0.7643 0.7238 0.6704 0.60846 0.000000000000000765
Proportion of Variance 0.0201 0.0195 0.0192 0.0186 0.0173 0.0146 0.0131 0.0112 0.00926 0.000000000000000000
Cumulative Proportion  0.8773 0.8967 0.9159 0.9345 0.9518 0.9664 0.9795 0.9907 1.00000 1.000000000000000000
                                       PC39                 PC40
Standard deviation     0.000000000000000223 0.000000000000000223
Proportion of Variance 0.000000000000000000 0.000000000000000000
Cumulative Proportion  1.000000000000000000 1.000000000000000000

I thought I would obtain the parameters that are the most important to use, but I just don't find this information. All I see are "standard deviation" etc. on the PCs. But how do I use this for prediction?

$\endgroup$
1

2 Answers 2

41
$\begingroup$

While I'm unsure as to the nature of your problem, I can tell you that I have used PCA as a means of extracting dominant patterns in a group of predictor variables in the later building of a model. In your example, these would be found in the principle components (PCs), PCAAnalysis$x, and they would be based on the weighting of variables found in PCAAnalysis$rotation. One advantage of this process is that PCs are orthogonal, and so you remove issues of multicollinearity between the model predictors. The second, is that you might be able to identify a smaller subset of PCs that capture the majority of variance in your predictors. This information can be found in summary(PCAAnalysis) or in PCAAnalysis$sdev. Finally, if you are interested in using a subset of the PCs for prediction, then you can set the tol parameter in prcomp to a higher level to remove trailing PCs.

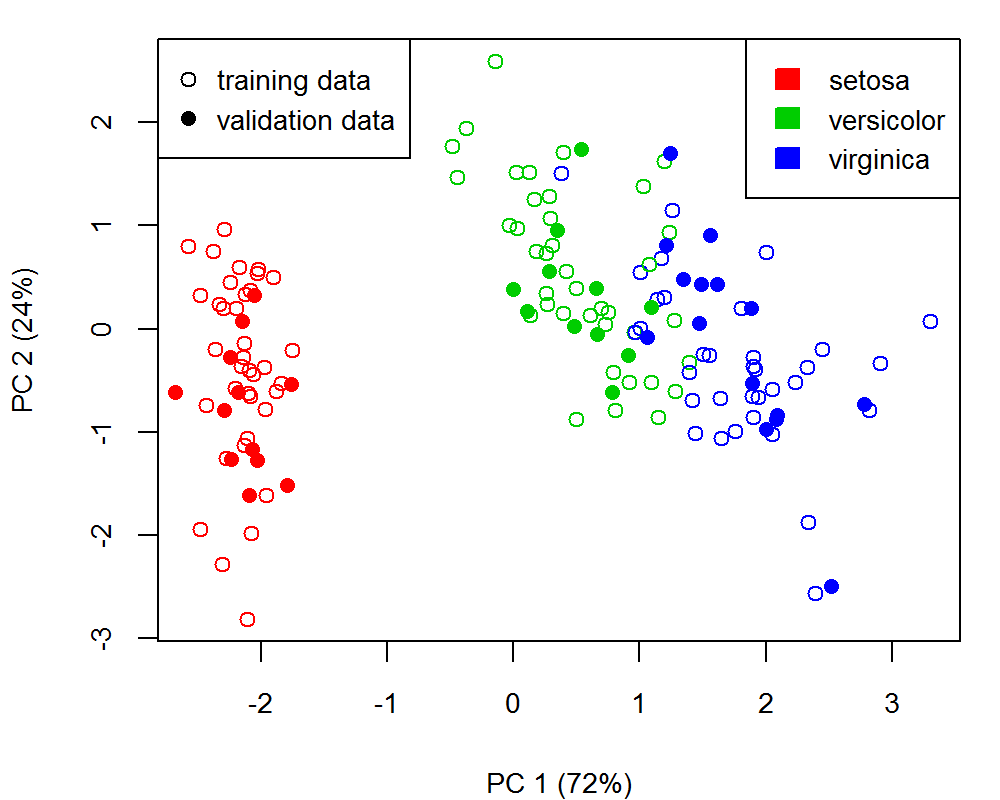
Now, you can "project" new data onto the PCA coordinate basis using the predict.prcomp() function. Since you are calling your data set a "training" data set, this might make sense to then project a validation data set onto your PCA basis for the calculation of their respective PC coordinates. Below is an example of fitting a PCA to 4 biometric measurements of different iris species (which are correlated to some degree). Following this, I project biometric values of a new data set of flowers that have similar combinations of these measurements for each of the three species of iris. You will see from the final graph that their projected PCs lie in a similar area of the plot as the original data set.

An example using the iris data set:

### pca - calculated for the first 4 columns of the data set that correspond to biometric measurements ("Sepal.Length" "Sepal.Width"  "Petal.Length" "Petal.Width")
data(iris)

# split data into 2 parts for pca training (75%) and prediction (25%)
set.seed(1)
samp <- sample(nrow(iris), nrow(iris)*0.75)
iris.train <- iris[samp,]
iris.valid <- iris[-samp,]

# conduct PCA on training dataset
pca <- prcomp(iris.train[,1:4], retx=TRUE, center=TRUE, scale=TRUE)
expl.var <- round(pca$sdev^2/sum(pca$sdev^2)*100) # percent explained variance

# prediction of PCs for validation dataset
pred <- predict(pca, newdata=iris.valid[,1:4])

###Plot result
COLOR <- c(2:4)
PCH <- c(1,16)

pc <- c(1,2) # principal components to plot

png("pca_pred.png", units="in", width=5, height=4, res=200)
op <- par(mar=c(4,4,1,1), ps=10)
plot(pca$x[,pc], col=COLOR[iris.train$Species], cex=PCH[1], 
 xlab=paste0("PC ", pc[1], " (", expl.var[pc[1]], "%)"), 
 ylab=paste0("PC ", pc[2], " (", expl.var[pc[2]], "%)")
)
points(pred[,pc], col=COLOR[iris.valid$Species], pch=PCH[2])
legend("topright", legend=levels(iris$Species), fill = COLOR, border=COLOR)
legend("topleft", legend=c("training data", "validation data"), col=1, pch=PCH)
par(op)
dev.off()

enter image description here

$\endgroup$
8
  • $\begingroup$ Thank you for providing so much details. Unfortunately the example code is too cryptic for me. I see you are using predict. Where is the manual for prcomp predict? is it here: stat.ethz.ch/R-manual/R-patched/library/stats/html/prcomp.html ? $\endgroup$ Commented Oct 16, 2013 at 5:36
  • $\begingroup$ I have now added more explanation to my answer. Hopefully it is clearer to you now. Yes, you were correct in your link to the predict.prcomp help. $\endgroup$ Commented Oct 16, 2013 at 7:32
  • $\begingroup$ @TimothéeHENRY, did the above answer work for you? If so, please mark it as the correct answer $\endgroup$
    – andy
    Commented Jun 11, 2020 at 8:49
  • $\begingroup$ @Marcinthebox, in the steps below, at what point did you create a model? I only see code that is predicting. $\endgroup$
    – andy
    Commented Jun 19, 2020 at 2:47
  • $\begingroup$ @1088 - The model is fit by the call to prcomp, using the training dataset (pca <- prcomp(iris.train[,1:4], retx=TRUE, center=TRUE, scale=TRUE)) $\endgroup$ Commented Jun 19, 2020 at 6:07
12
$\begingroup$

The information from the summary() command you have attached to the question allows you to see, e.g., the proportion of the variance each principal component captures (Proportion of variance). In addition, the cumulative proportion is computed to output. For example, you need to have 23 PCs to capture 75% of the variance in your data set.

This certainly is not the information you typically use as input to further analyses. Rather, what you usually need is the rotated data, which is saved as 'x' in the object created by prcomp.

Using R code as a short example.

pr<-prcomp(USArrests, scale = TRUE)
summary(pr) # two PCs for cumulative proportion of >80% 
newdat<-pr$x[,1:2]

Then you can use the data in the newdat for further analyses, e.g., as input to SVM or some regression model. Also, see, e.g., https://stackoverflow.com/questions/1805149/how-to-fit-a-linear-regression-model-with-two-principal-components-in-r for more information.

$\endgroup$
6
  • 1
    $\begingroup$ Thank you @JTT. So if I now use newdat to create a SVM model, I suppose my model takes input in this new rotated universe, which means I will need to also rotate my Test data before applying it to the model. Is this correct? And if yes, how do you rotate a test data.frame with the same rotation? $\endgroup$ Commented Oct 16, 2013 at 5:24
  • 4
    $\begingroup$ The easiest way is to use the predict() method for the test data. Using the example above, predict(pr, USArrests) will return the same matrix as pr$x. For test data, replace the USarrests with the name of the test data. You can do the same thing by hand, but this is easier, since the predict methods takes automatically care of the correct scaling of the test data set. $\endgroup$
    – anon
    Commented Oct 16, 2013 at 5:36
  • 1
    $\begingroup$ How does predict work? Does it use all Principal Compenents. In your answer you had chosen only 2 Components to cover 80% of variance. What does predict do? $\endgroup$ Commented Oct 16, 2013 at 5:44
  • 1
    $\begingroup$ The function predict() uses by default all the components. However, you can limit the number of components that are returned, e.g., `predict(pr, USArrests)[,1:2]. Would that work for you? $\endgroup$
    – anon
    Commented Oct 16, 2013 at 6:33
  • 1
    $\begingroup$ Do you need to center and scale your new data prior to prediction? Or does predict() do that automatically given the initial parameters with prcomp()? $\endgroup$
    – Dale Kube
    Commented Dec 7, 2018 at 5:49

Not the answer you're looking for? Browse other questions tagged or ask your own question.