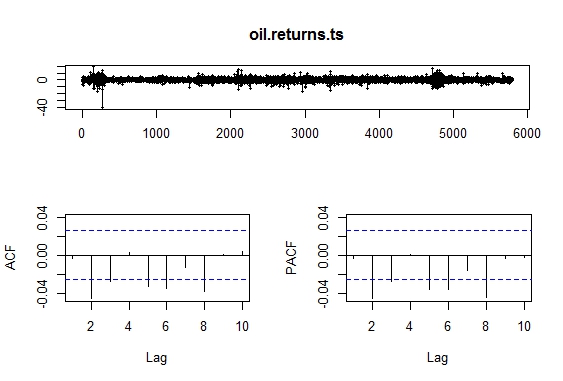
So I plotted the ACF/PACF of oil returns and was expecting to see some positive autocorrelation but to my surprise I only get negative significant autocorrelation. How should I interpret the above graph? They seem to indicate that there is a tendency for oil returns to increase when it decreased previously and vice-versa, thus the oscillating behaviour. Please correct me if I'm wrong.
1 Answer
$\begingroup$
$\endgroup$
4
Negative ACF means that a positive oil return for one observation increases the probability of having a negative oil return for another observation (depending on the lag) and vice-versa. Or you can say (for a stationary time series) if one observation is above the average the other one (depending on the lag) is below average and vice-versa. Have a look at "Interpreting a negative autocorrelation".
-
3$\begingroup$ In practice, however, the autocorrelations you show are all very small: although some are significant at conventional levels they should not be over-interpreted. Correlations about 0.02 don't imply much predictive ability. $\endgroup$– Nick CoxCommented Oct 26, 2013 at 15:37
-
$\begingroup$ Would it make sense if I tried fitting an ARMA-GARCH model to this dataset?Would it make sense to use ARMA for correlation this small?I know I can just fit the return in a GARCH model but I don't want to end up with constant 0 when forecasting return. $\endgroup$– ankcCommented Oct 26, 2013 at 17:32
-
$\begingroup$ @Stat, can you answer the above questions please? thanks $\endgroup$– ankcCommented Oct 28, 2013 at 7:37
-
$\begingroup$ Sorry Andy, I thought I have answered them. Well, you can try both of them, and then check your models to see which one fits better to the returns and provides a reasonable forecast. But as Nick said, you don't have that much correlation, and that makes it difficult to find a good time series model. $\endgroup$– StatCommented Oct 28, 2013 at 15:20