The bivariate normal distribution with mean $\mu$ and covariance matrix $\Sigma$ can be re-written in polar coordinates with radius $r$ and angle $\theta$. My question is: What is the sampling distribution of $\hat{r}$, that is, of the distance from a point $x$ to the estimated center $\bar{x}$ given the sample covariance matrix $S$?
Background: The true distance $r$ from a point $x$ to mean $\mu$ follows a Hoyt distribution. With eigenvalues $\lambda_{1}, \lambda_{2}$ of $\Sigma$, and $\lambda_{1} > \lambda_{2}$, its shape parameter is $q=\frac{1}{\sqrt{(\lambda_{1}+\lambda_{2})/\lambda_{2})-1}}$, and its scale parameter is $\omega = \lambda_{1} + \lambda_{2}$. The cumulative distribution function is known to be the symmetric difference between two Marcum Q-functions.
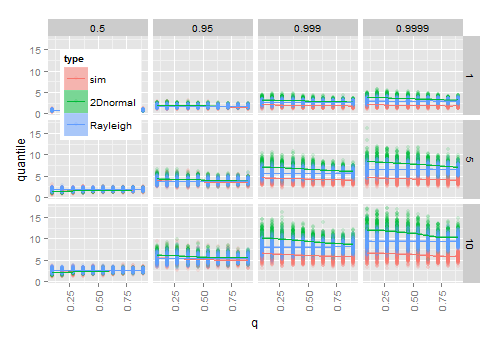
Simulation suggests that plugging in estimates $\bar{x}$ and $S$ for $\mu$ and $\Sigma$ into the true cdf works for large samples, but not for small samples. The following diagram shows the results from 200 times
- simulating 20 2D normal vectors for each combination of given $q$ ($x$-axis), $\omega$ (rows), and quantile (columns)
- for each sample, calculating the given quantile of the observed radius $\hat{r}$ to $\bar{x}$
- for each sample, calculating the quantile from the theoretical Hoyt (2D normal) cdf, and from the theoretical Rayleigh cdf after plugging in the sample estimates $\bar{x}$ and $S$.

As $q$ approaches 1 (the distribution becomes circular), the estimated Hoyt quantiles approach the estimated Rayleigh quantiles which are unaffected by $q$. As $\omega$ grows, the difference between the empirical quantiles and the estimated ones increases, notably in the tail of the distribution.
