1
$\begingroup$

After fitting a multinomial model to my data with the "multinom" function (package nnet), I want to show the effect of selected variables controlling for other variable values. I know that the "effects" package do mainly what I want, but I want to be able to calculate the prediction error (confidence interval) by myself. Does someone could tell me the methodology and if possible the R code? I think we should use the delta method, but I'm not sure how to apply it in this case.

Here is a small example code (based on data available in the effects package)

library(nnet)
library(effects)
mod <- multinom(vote ~ age + gender, data=BEPS)
summary(mod)

# Call:
# multinom(formula = vote ~ age + gender, data = BEPS)

# Coefficients:
#                  (Intercept)         age gendermale
# Labour             1.2241862 -0.01562320  0.1682676
# Liberal Democrat   0.4979706 -0.01551381  0.1240998

# Std. Errors:
#                  (Intercept)         age gendermale
# Labour             0.2277826 0.003830006  0.1204621
# Liberal Democrat   0.2694373 0.004578836  0.1436882

# Residual Deviance: 3186.266 
# AIC: 3198.266 

plot(allEffects(mod))
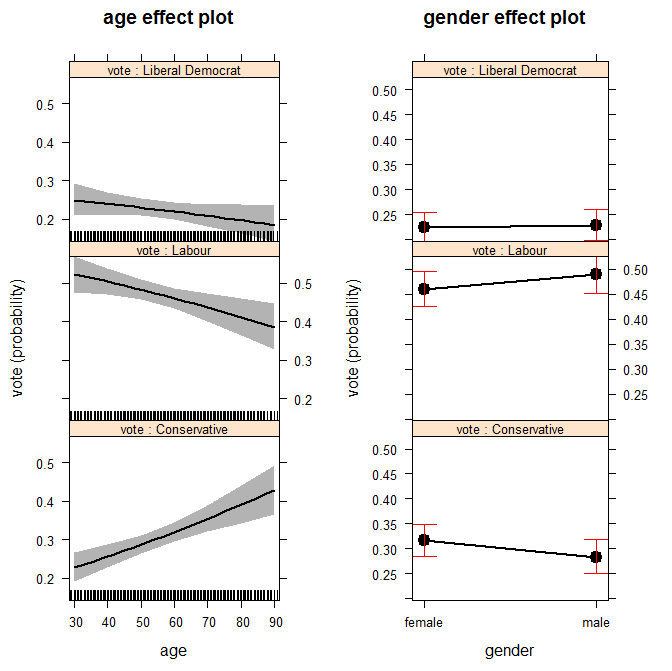
output of the effect function

The only thing I need is to be able to calculate the values of errors shown in this graph !

Thank you in advance,

$\endgroup$
5
  • $\begingroup$ Request for mini-tutorials when not accompanied by code that creates an appropriate demonstration set get my close vote. The text in the close dialog that I choose is: "Questions asking us to recommend or find a tool, library or favorite off-site resource are off-topic for Stack Overflow as they tend to attract opinionated answers and spam. Instead, describe the problem and what has been done so far to solve it." $\endgroup$
    – DWin
    Commented May 15, 2014 at 20:10
  • $\begingroup$ Requesting migration. $\endgroup$
    – DWin
    Commented May 16, 2014 at 2:07
  • $\begingroup$ @BondedDust I added some code and a figure to explain my query. Hope this meet your requirements! $\endgroup$
    – Arnaud
    Commented May 16, 2014 at 13:06
  • $\begingroup$ @BondedDust I also tried to find the answer reading the R code from the function, but the R code of the Effect function call a C code ... then I do not understand what is done ... $\endgroup$
    – Arnaud
    Commented May 16, 2014 at 13:23
  • $\begingroup$ Possible duplicate of stats.stackexchange.com/questions/67460/…. $\endgroup$ Commented Jul 29, 2015 at 9:14

0

Your Answer

By clicking “Post Your Answer”, you agree to our terms of service and acknowledge you have read our privacy policy.

Browse other questions tagged or ask your own question.