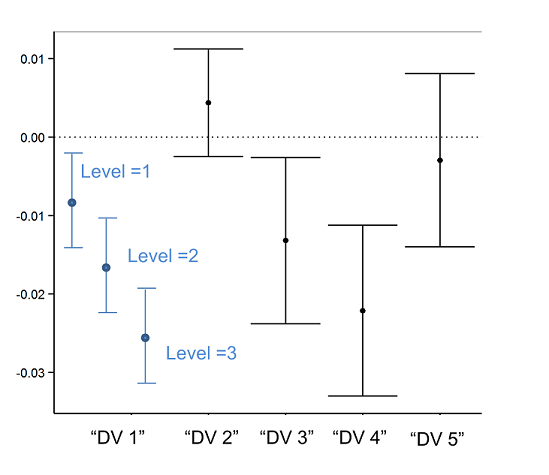
I'm comparing the slopes of several different response variables (DVs; representing different populations) to a set of predictors (IVs). For some DVs a 2-way interaction (continuous by continuous) is supported. To facilitate my comparison of IV coefficients I'd like to plot the slope estimates and 95% CI on a single graph (separate graph for each IV), and for the DV's with an interaction I'd like to plot the slope at ~3 values of the continuous moderator variable (e.g., "DV 1" in figure below).

I'm sure there is a variety of ways to get these values, but I'm hoping someone can point me to a simple bit of code or a package that can help automate this process for me. I should also note my models are from lme4.
The 'effects' package handily calculates predicted values at user-specified levels of the moderator variable, but doesn't provide slopes or SE to my knowledge (although I could figure these out from the predicted values, I'm hoping for a more stream-lined method).
Here is some toy data, although it doesn't produce an interaction like I show in the figure;
set.seed(50)
x1 <- rnorm(100,2,10)
x2 <- rnorm(100,2,10)
y1 <- x1+x2+x1*x2+rnorm(100,0,100)

model1<-lm(y1 ~ x1*x2)
And here is the predicted values plotted from 'effects', but I want the slopes and SE of these lines...
library(effects)
model1.eff<-effect("x1*x2",model1,xlevels=3)
plot(model1.eff,multiline=T,ci.style="bands")
as.data.frame(model1.eff)
