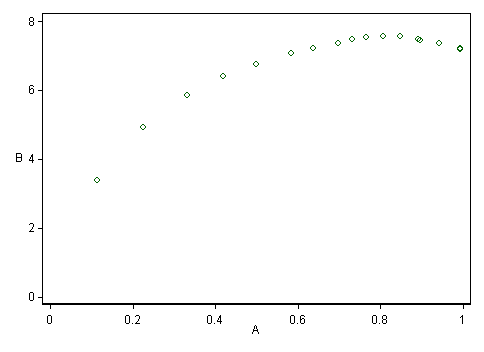
This is more by way of extra comments than a full answer, but I have a graph and summary statistics that can only be well shown in an answer.
There are more decimal places here than may make sense, but they show up details that could be crucial:
    Variable |       Obs        Mean    Std. Dev.       Min        Max
-------------+--------------------------------------------------------
           A |        20    .7150387    .2726499   .1132056    .993776
           B |        20    6.880924    1.051601   3.377351   7.571167
The summaries for
Aare suggestive of a measure bounded by 0 and 1, but what are the limits? Are 0 and 1 defined in principle? Attainable in practice? What about values beyond 0 and 1?The range of possibilities for
Bis not clear. But again any comment you can make about bounds in principle and bounds in practice could be very helpful.The sample data make clear to me that there is a subtle but definite turning point in this case around
A$\sim 0.8$, so contrary to comments earlier made. relationships cannot be said to be all monotonic.

Note that a curve of the form $a + b \log A$ will not capture the turning-point, as it can only be monotonic. (Presumably your $x \equiv A$.) Quadratics and higher polynomials can naturally possess turning points.
- To me the points suggest a well-defined relationship, the problem being merely that seems hard to suggest a functional form for that on the information to date! As in points 1 and 2, whatever information you can provide on what the data are, and how they should behave, should help greatly. Subject-matter comments can sometimes rule some analyses out as physically (biologically, ...) absurd or unhelpful and sometimes rule analyses in as being the opposite. My most specific concern is that an upper limit of 1 should feature even in simple modelling if it is a real limit.
