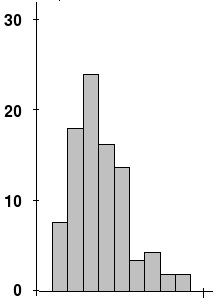
Imagine I have a distribution like the following

File SkewedDistribution.png of Wikimedia Commons by User:Audriusa licensed under CC-BY-SA 3.0
Now I want to measure, how this distribution differs from being normally distributed. What can I do?
My attempt: I cannot use the skewness because this only measures the symmetry of my distribution. Another way would be to calculate $\inf_{N\in\mathcal N} d(X,N)$ whereby $\mathcal N$ is the set of all normal distributions (i.e. the set of all distributions with density function $\frac{1}{\sigma\sqrt{2\pi} } \; e^{ -\frac{(x-\mu)^2}{2\sigma^2} }$) and $d$ is a metric for distributions. Is this a good choice for measuring the difference of being normally distributed?
