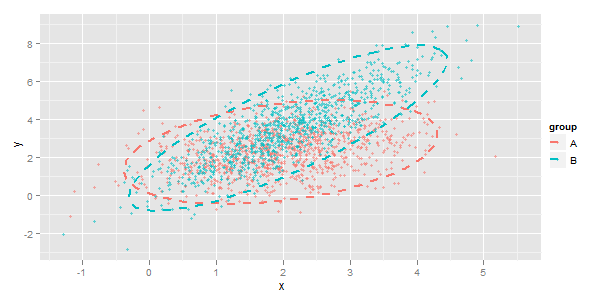
I found the answer at: http://stackoverflow.com/questions/2397097/how-can-a-data-ellipse-be-superimposed-on-a-ggplot2-scatterplot
#bootstrap
set.seed(101)
n <- 1000
x <- rnorm(n, mean=2)
y <- 1.5 + 0.4*x + rnorm(n)
df <- data.frame(x=x, y=y, group="A")
x <- rnorm(n, mean=2)
y <- 1.5*x + 0.4 + rnorm(n)
df <- rbind(df, data.frame(x=x, y=y, group="B"))

#calculating ellipses
library(ellipse)
df_ell <- data.frame()
for(g in levels(df$group)){
df_ell <- rbind(df_ell, cbind(as.data.frame(with(df[df$group==g,], ellipse(cor(x, y),
                                         scale=c(sd(x),sd(y)),
                                         centre=c(mean(x),mean(y))))),group=g))
}
#drawing
library(ggplot2)
p <- ggplot(data=df, aes(x=x, y=y,colour=group)) + geom_point(size=1.5, alpha=.6) +
  geom_path(data=df_ell, aes(x=x, y=y,colour=group), size=1, linetype=2)

