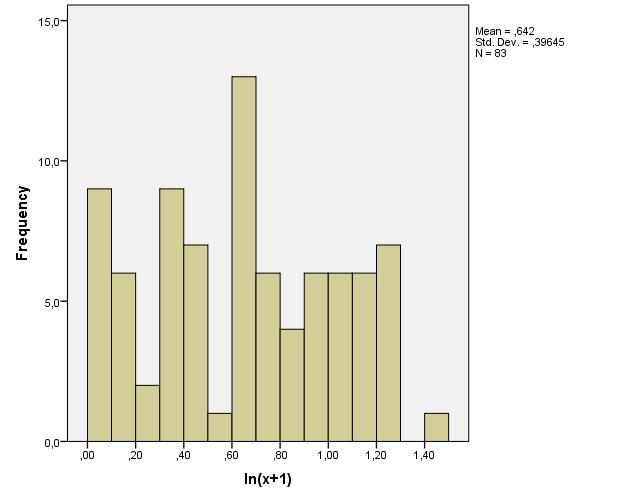
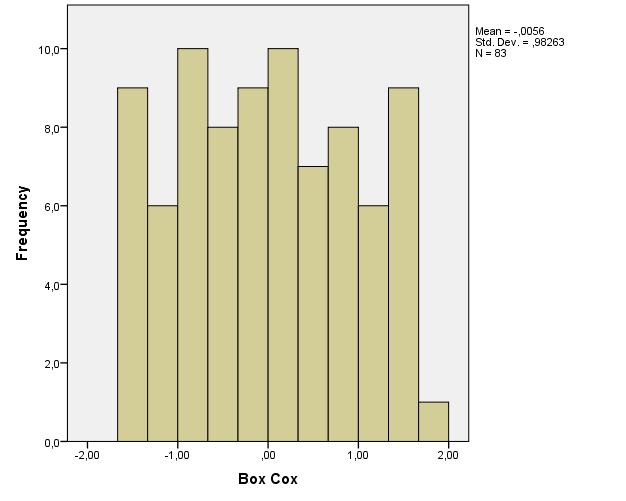
I would like to perform General Linear Model with one response variable and two predictor variables (1 numeric, 1 categorical). The response variable is positively skewed and transformations don't seem to bring it closer to normality. I tried sqrt, logarithmic, inverse and Box Cox transformations (performed by SPSS). Is there any other way to transform it? Can Generalized Linear Model work with such skewed data (I'm not very familiar with it)? Here are the data:
Response: 0.0, 0.0, 0.0, 0.0, 0.0, 0.0, 0.0, 0.0, 0.0, 0.3, 0.5, 0.5, 0.5, 0.5, 0.5, 0.8, 0.8, 1.0, 1.0, 1.0, 1.0, 1.0, 1.0, 1.2, 1.3, 1.5, 1.6, 1.8, 2.0, 2.0, 2.0, 2.0, 2.0, 2.5, 3.0, 3.0, 3.0, 3.0, 3.0, 3.0, 3.4, 3.4, 3.5, 3.5, 3.8, 4.0, 4.0, 4.2, 4.3, 4.5, 5.0, 5.0, 5.3, 5.8, 6.0, 6.0, 6.5, 7.0, 7.2, 7.5, 7.7, 8.0, 8.7, 9.3, 9.5, 10.0, 10.0, 10.5, 11.0, 11.6, 12.5, 13.0, 14.0, 14.5, 14.7, 15.0, 15.0, 15.0, 15.0, 16.0, 18.0, 18.0, 25.0
Numeric predictor: 0.9, 2.6, 3.2, 6.6, 80.1, 41.4, 22.3, 29.8, 14.5, 9.9, 5.7, 6.7, 9.9, 19.0, 23.0, 0.3, 23.0, 1.0, 5.7, 7.4, 14.5, 14.5, 22.3, 7.0, 29.8, 9.6, 9.6, 12.0, 4.5, 5.8, 7.6, 7.6, 23.0, 23.0, 3.2, 5.1, 7.0, 7.3, 6.6, 23.0, 5.5, 0.4, 3.6, 12.0, 22.3, 7.6, 12.4, 0.9, 0.0, 1.0, 6.4, 11.0, 22.3, 2.2, 4.9, 22.3, 4.7, 5.2, 2.1, 14.5, 0.9, 8.3, 4.9, 22.3, 4.5, 3.3, 5.1, 9.9, 46.3, 1.1, 21.0, 3.6, 5.8, 0.8, 22.3, 0.2, 0.4, 3.6, 4.9, 11.0, 7.9, 9.6, 0.1
Categorical predictor: A, A, A, A, A, AT, T, T, T, A, A, A, AT, T, T, A, T, A, A, A, T, T, T, A, T, A, AT, A, A, A, A, A, T, T, A, A, A, A, AT, T, A, A, A, A, T, A, T, A, A, A, A, AT, T, A, T, T, A, A, A, T, A, AT, T, A, A, A, A, AT, A, A, A, A, A, T, A, A, A, T, T, A, A, A


