Warning: it's a great question and I don't know the answer, so this is really more of a "what I would do if I had to":
In this problem there are lots of degrees of freedom and lots of comparisons one can do, but with limited data it's really a matter of aggregating data efficiently. If you don't know what test to run, you can always "invent" one using permutations:
First we define two functions:
Voting function: how to score the rankings so we can combine all the rankings of a single group. For example, you could assign 1 point to the top ranked item, and 0 to all others. You'd be losing a lot of information though, so maybe it's better to use something like: top ranked item gets 1 point, second ranked 2 points, etc.
Comparison function: How to compare two aggregated scores between two groups. Since both will be a vector, taking a suitable norm of the difference would work.
Now do the following:
- First compute a test statistic by computing the average score using the voting function for each item across the two groups, this should lead to two vectors of size 25.
- Then compare the two outcomes using the comparison function, this will be your test statistic.
The problem is that we don't know the distribution of the test statistic under the null that both groups are the same. But if they are the same, we could randomly shuffle observations between groups.
Thus, we can combine the data of two groups, shuffle/permute them, pick the first $n_1$ (number of observations in original group A) observations for group A and the rest for group B. Now compute the test statistic for this sample using the preceding two steps.
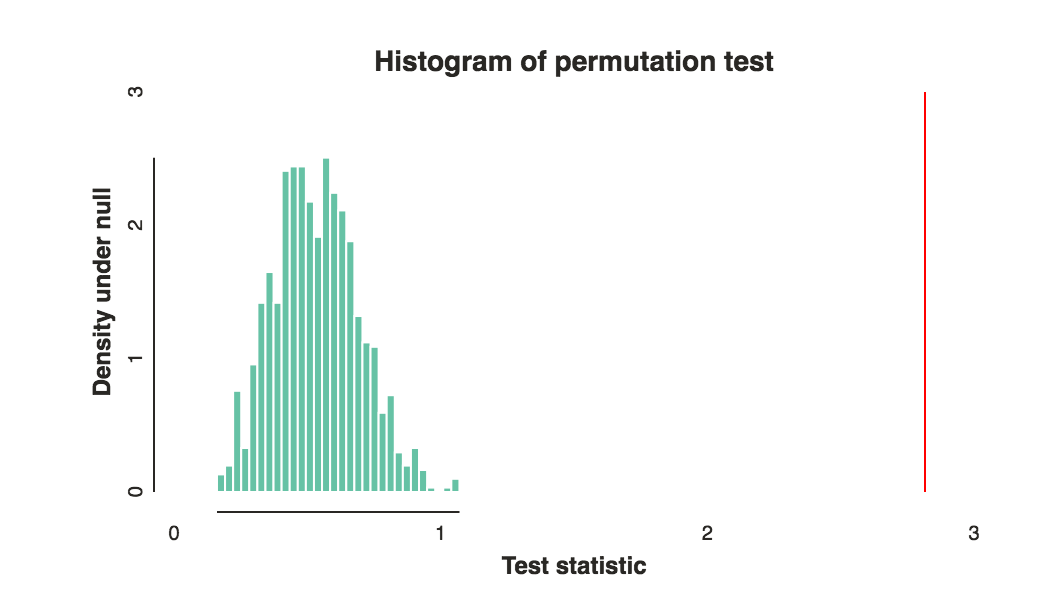
Repeat the process around 1000 times, and now use the permutation test statistics as empirical null distribution. This will allow you to compute a p-value, and don't forget to make a nice histogram and draw a line for your test statistic like so:
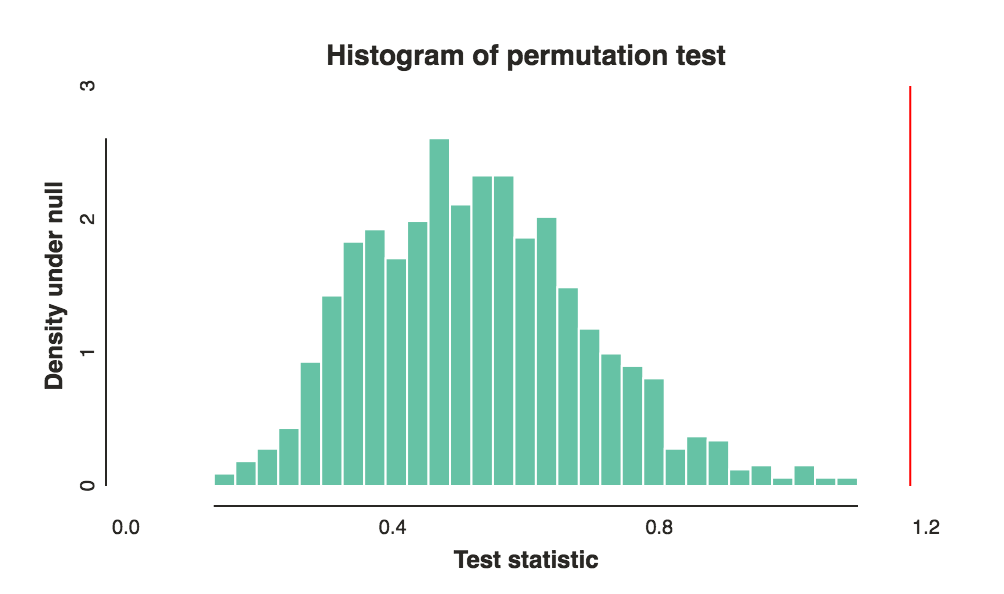
Now of course it is all about choosing the right voting and comparison functions to get good power. That really depends on your goal and intuition, but I think my second suggestion for voting function and the $l_1$ norm are good places to start. Note that these choices can and do make a big difference. The above plot was using the $l_1$ norm and this is the same data with an $l_2$ norm:
But depending on the setting, I expect there can be a lot of intrinsic randomness and you'll need a fairly large sample size to have a catch-all method work. If you have prior knowledge about specific things you think might be different between the two groups (say specific items), then use that to tailor your two functions. (Of course, the usual do this before you run the test and don't cherry-pick designs till you get something significant applies)
PS shoot me a message if you are interested in my (messy) code. It's a bit too long to add here but I'd be happy to upload it.


