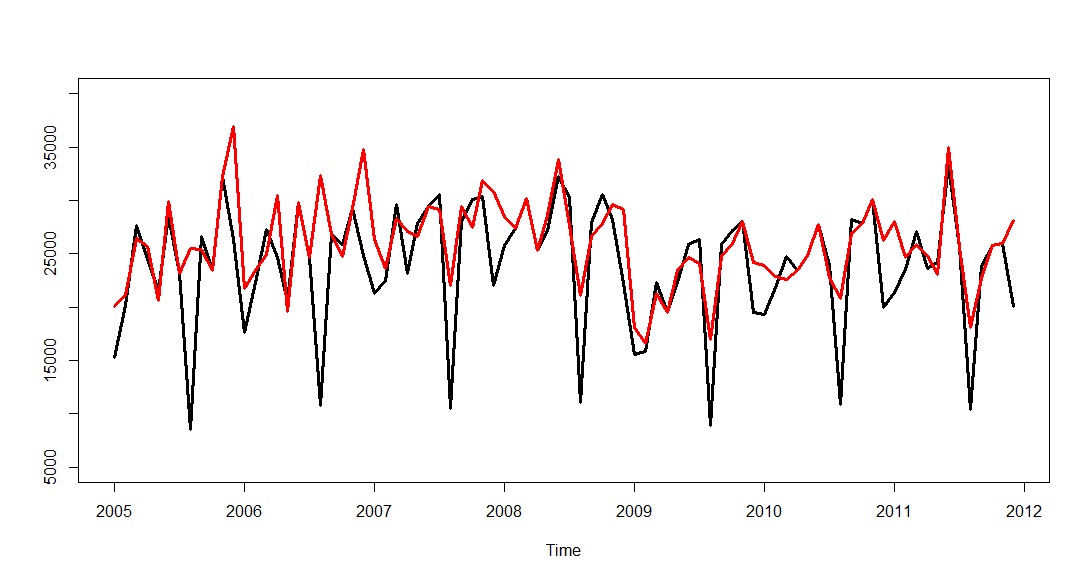
Ok now, let's try this for comparison. What if I remove calendar effects by dividing the original time serie by the number of actual working days in each month and then I multyply the results by 21?
The original time-serie is in black, and the calendar-adjusted one is in red:

The first thing that popped into my mind is: hey, are these data really seasonal? August might be, but what about November/December? It seems to me that working-day adjustment cancels out most, if not all, of the seasonality for the winter months. How do you guys see it?
On top of that: I still notice the pulse in Nov'05 and Jan'09, I'm not really sure about May'06 and it seems to me like Jan'08 might have been more of a matter related to working days than to an actual pulse.
Also, I can totally see the level shift in Feb'09, but what about the one in Dec'06? Isn't it more like a side-effect of the Nov'06 pulse (is Nov'06 even a pulse considering calendar-adjusted data)? The serie went up so high that, when it came back down, it seemed like a shift in level. Does the pulse-adjusted data still generate a level shift warning in Dec'06?
Again, the idea here is to try and see if pre-processing of data might actually improve correct outlier identification. I think a side-by-side test like this might help. IrishStats (or anyone else) care to accept the challenge? :-)
