I can suggest a couple of paths that you might find useful. The first is my my answer to a StackOverflow question, Artificial Intelligence Methods to Detect Cheating in Games. The question was not limited to collusion but that was in fact the scope of my answer.
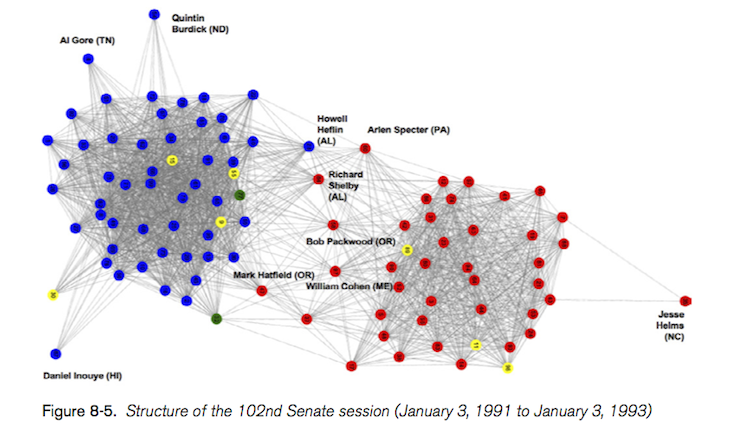
The second source is an excellent study by Andrew Odewahn, which i first learned in the O'Reilly compilation, Beautiful Visualization (ch 8). In this study Odewahn looks at congressional voting records for the purpose of of identifying which members of congress tend to vote together on the same bill. To do this, he creates an Affinity Matrix (which is analogous to an adjacency matrix, a common way to represent graph structures for computation.
It seemed to me from reading your Question that you either don't yet have a hypothesis regarding which judges might be colluding or you deliberately want to remain neutral on the matter and instead consider all voting patterns among all possible pairings/groupings of judges. So that's where an affinity matrix or a rendered graph might be an excellent place to begin. For instance, a rendered graph (like the one below) represents the edge weights (the number of time the two judges connected by that edge voted together) as an attractive force, hence the more two judges vote together, the closer their nodes appear in the rendered graph.
Here is one of the rendered graphs from his study (rendered in graphviz) the two different colors represent the two political parties:

