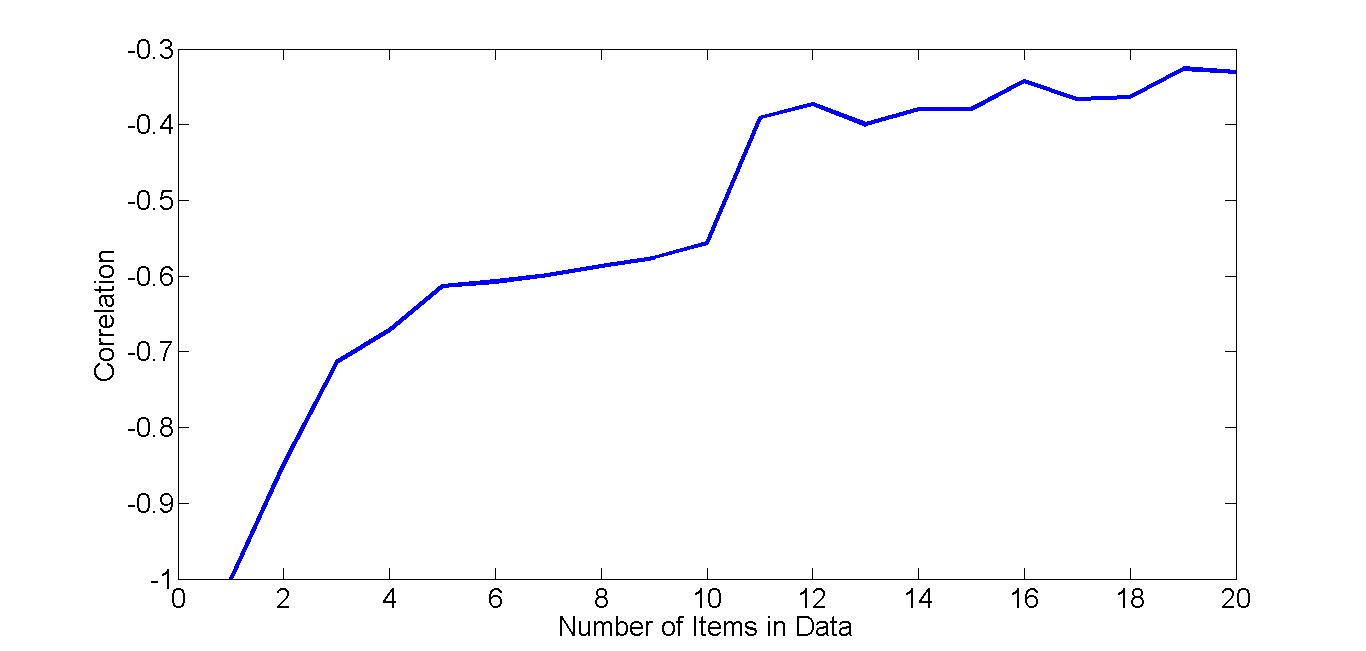
Say, I have 2 parameters, and based on my dataset, I have iteratively calculated the correlation coefficients between them by taking the correlation of the first i terms, where i ranges from 1 to the size of the dataset.
Now, if I plot these cumulative correlation coefficients and I find a plot which is - (i) almost a straight line (ii) an increasing line (iii) a decreasing line, what can I infer about the 2 parameters in each of these 3 cases?
EDIT: Say this is out dataset, called data, containing 2 columns, which are the 2 parameters:
data = [0.450000000000000   13761
        0.716670000000000   11771
        0.265430000000000   37677
        0.403850000000000   12442
        0.451610000000000   10930
        0.282760000000000   17867
        0.386790000000000   16897
        0.383840000000000   16113
        0.342340000000000   16980
        0.402170000000000   13279
        0.389470000000000   12260
        0.366340000000000   53651
        0.375000000000000   12145
        0.600000000000000   11715
        0.333330000000000   15281
        0.416670000000000   14765
        0.278690000000000   14705
        0.523080000000000   10698
        0.386360000000000   15375
        0.257580000000000   14221]
Here is the MATLAB code to evaluate the cumulative correlations:
for i=1:size(data,1)-1
    C(i,1)=corr(data(1:i+1,1), data(1:i+1,2));
end
C(i+1,1)=corr(data(:,1), data(:,2));
Here is a part of the cumulative correlations, i.e., the output generated by the above code. The value in row i gives the correlation between elements 1 to i.
C = [-1
     -0.847686164758662
     -0.713720818907561
     -0.671570356292160
     -0.613123243096027
     -0.607412588640115
     -0.598822279828159
     -0.586376036290086
     -0.575999372323042
     -0.556829393824720
     -0.391060629488105
     -0.373141161547034
     -0.399999928278309
     -0.379689459376855
     -0.379704922466728
     -0.342786167856004
     -0.366493259831476
     -0.363622806570060
     -0.326063468688077
     -0.330843968356523]
The graph obtained by plotting C is:

So, what does this graph signify? How can we interpret it?
