Thanks for posting the data.
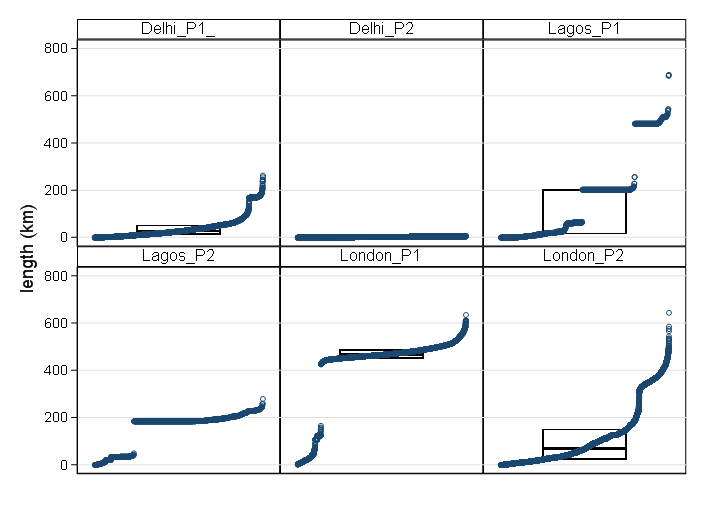
Following a suggestion from @whuber I focus on lengths (as likely to be better behaved).
One variable is LENGTH_M which I guess is length in metres. To avoid very large numbers on axes I divided by 1000 and call the result length in km. If that's wrong it's just a cosmetic issue for the graphs.
I then drew quantile-box plots which are quantile plots with median and quartile boxes superimposed. The results help to explain why the original box plots look rather odd but also underline how box plots can often omit illuminating detail.
I think there's a serious question about what these data mean, if anything. The gaps in distributions suggest minimally that you have a mixture of quite different entities and maximally that data quality is here compromised.
Also, from a knowledge of urban geography I know that Lagos is big, indeed very big, but that some individual area (i.e. part of the whole) is associated with a length of 689 km still seems extraordinary, regardless of how that length is defined. But this is partly a question of whether original lengths are in metres, which is where I started.

