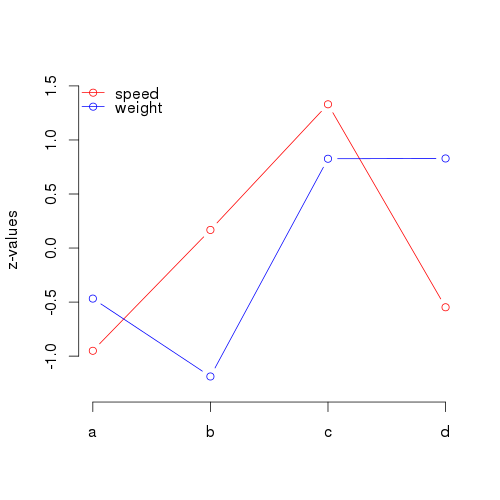
You could also transform absolute scales into relative by using z-transformation (or any other that you think is more suitable).
speed  = c(2.2, 4.7, 7.3, 3.1)
weight = c(500, 222, 999, 1000)
speed=scale(speed)
weight=scale(weight)
rng=extendrange(range(c(speed,weight)))

plot(speed, type="b", col="red", ylim=rng,ylab="z-values",xlab="",xaxt="n",bty="n")
points(weight, type="b",col="blue")
legend("topleft",legend=c("speed","weight"),col=c("red","blue"),lty=1, bty="n",pch=1)
axis(1, at=lbls, labels=lbls)

The nice feature of this approach is that it can be used on more than two scales. And although it is not as informative on the values of individual points, it makes scales more comparable.
