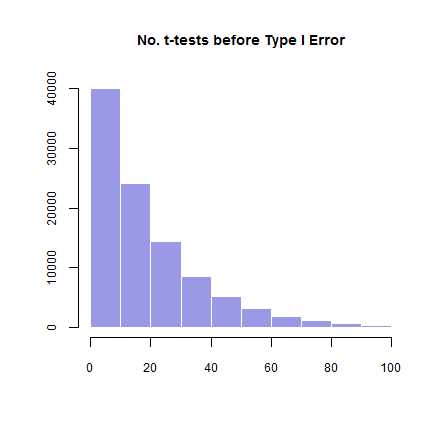
Just to replicate this post dwelling on a different iteration of the same idea - in this case how quickly an unscrupulous researcher could generate throw-away pseudo-science with significant p values, I landed on this page, and learned from the accepted answer (+1).
Here is the code in R, and the results for mean, median and mode, which sounds like what you are asking in the follow-up comment:
set.seed(3141592)
firsthackingop <- 0  # Empty vec to collect number of studies before hitting the jackpot.
for(i in 1:1e5){     # The whole search for a sig p value will be done 100,000 times.
hackingwait <- 1     # The counting vector for every p-searching Safari.
  repeat{
  x=rnorm(100, 0, 1) # 100 draws from a norm dist as in @overwhelmed's answer.
  if(t.test(x, mu=0)$p.value > 0.05){hackingwait=hackingwait+1}else{break}
}
firsthackingop[i] <- hackingwait
}
mean(firsthackingop)
# [1] 20.17556
median(firsthackingop)
# [1] 14
Mode <- function(x) {
  ux <- unique(x)
  ux[which.max(tabulate(match(x, ux)))]
}
Mode(firsthackingop)
[1] 1
hist(firsthackingop, freq = T, main = "No. t-tests before Type I Error",
          xlim=c(0,100), col = rgb(.2,.2,.8,.5), border = F,
          cex.axis=.75, cex.main=.9, xlab="", ylab="")
Here is the histogram:

