Dan and Michael point out the relevant issues. Just for completeness, the relationship between adjusted $R^2$ and $R^2$ is given by (see, e.g., here)
$$ R^2_{adjusted}=1-(1-R^2)\frac{n-1}{n-2}, $$ showing that $R^2_{adjusted}=1$ if and only if $R^2=1$, which, in turn, happens when all residuals $\hat u_i$ are zero, as $$ R^2=1-\frac{\hat{u}'\hat{u}/n}{\tilde{y}'\tilde{y}/n}. $$ Here, $\hat u$ denotes the vector of residuals and $\tilde y$ the vector of demeaned observations on the dependent variable.
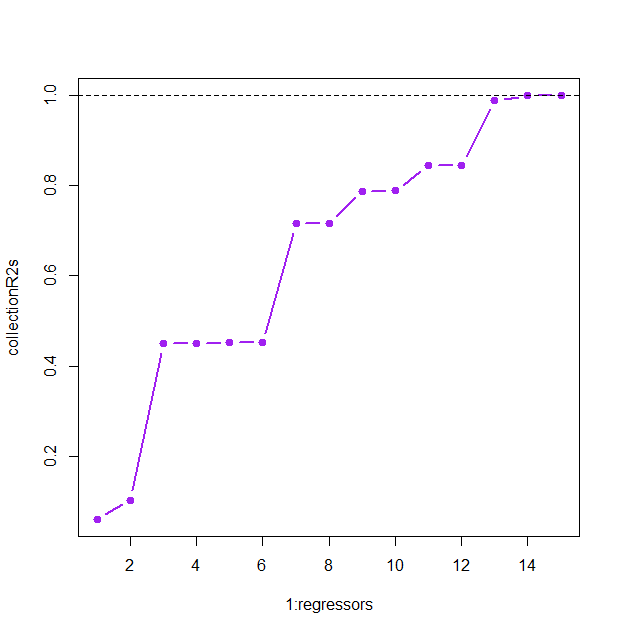
Dan discusses one reason to get an $R^2$ of 1. Another is to have as many regressors as observations. So in your case, as suspected by mdewey, you maybe also only have 15 observations, in which case $R^2$ must be equal to one.
Here is an illustration using artificial data, in which regressors are generated totally independently of $y$, and yet we achieve an $R^2$ of 1 once we have as many of them as we have observations.
Code:
n <- 15
regressors <- n
y <- rnorm(n)
X <- matrix(rnorm(regressors*n),ncol=regressors)

collectionR2s <- rep(NA,regressors)
for (i in 1:regressors){
  collectionR2s[i] <- summary(lm(y~X[,1:i]))$r.squared
}
plot(1:regressors,collectionR2s,col="purple",pch=19,type="b",lwd=2)
abline(h=1, lty=2)

