I am fitting a mixed-effects model with the following specification:
mixed_eff_model = lmer(log(Y) ~ A + B + C + D + (D | M),
                       data = data_df,
                       REML = FALSE,
                       control = lmerControl(optimizer = "Nelder_Mead"))
The output is as follows:
Linear mixed model fit by maximum likelihood  ['lmerMod']
Formula: log(Y) ~ A + B +  C + D + (D | M)
Data: data_df
Control: lmerControl(optimizer = "Nelder_Mead")

  AIC       BIC    logLik  deviance  df.resid
 392207.9  392298.8 -196095.0  392189.9    178993

Scaled residuals:
    Min      1Q  Median      3Q     Max
-1.4909 -0.6930 -0.2866  0.3907  8.1989

Random effects:
 Groups         Name                      Variance Std.Dev. Corr
 M              (Intercept)               2.0710   1.4391
                 D1                       5.1665   2.2730   0.46
 Residual                                 0.5235   0.7235
 Number of obs: 179002, groups:  M, 3

Fixed effects:
                            Estimate Std. Error t value
(Intercept)               -1.807e+02  3.262e+00 -55.413
A                         2.462e-03  8.726e-04   2.822
B                         9.098e-03  5.228e-04  17.402
C                         9.437e-02  1.563e-03  60.371
D1                       -1.065e+00  1.312e+00  -0.812
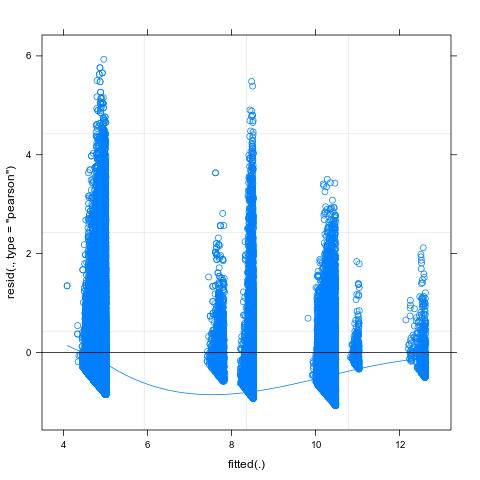
When I plot the residuals using: plot(mixed_eff_model, type = c('p', 'smooth'), the output is as follows:
I have two questions:
- Does this indicate that the linear model is potentially misspecified?
- How do I correct the model to account for this observation?

