Note gung's question; it matters. I will assume that the treatment was the same for every tank in the treatment group.
If you can argue the variance would be equal for the two groups (which you would typically assume for a two sample t-test anyway), you can do a test. You just can't check that assumption, no matter how badly violated it might be.
The concerns expressed in this answer to a related question are even more relevant to your situation, but there's less you can do about it.
You ask about it being reasonable to assume the variances are equal. We can't answer that for you, that's something you'd have to convince subject matter experts (i.e. ecologists) was a reasonable assumption. Are there other studies where such levels have been measured under both treatment and control? Others where similar tests (t-tests or anova especially - I bet you can find a better precedent) have been done or similar assumptions made? Some form of general reasoning you can see to apply?
However, it is important to note that for correctness of the significance level, you would only need equal variance under $H_0$. If the treatment had no effect under $H_0$ rather than just no effect on the mean, then this would hold. This might be a perfectly defensible position. If it was the case that the variance changed as the mean changed - something that is often the case with measured quantities that are inherently positive - then the test still works, though it may not be the most powerful test possible.
If $\bar{x}$ is the sample mean of the treatment and $\bar{y}$ is the mean of the control, and both are from normal distributions with variance $\sigma^2$, then $\bar{x}-\bar{y}$ will have mean $\mu_x - \mu_y$ and variance $\sigma^2 (1/n_x + 1/n_y)$ irrespective of whether one of the $n$'s is 1.
So when $n_y$ is 1,
$$ \frac{(\bar{x}-\bar{y})}{s_x\sqrt{1/n_x+1}} $$
(where $s_x$ is the standard deviation computed from the treatments) will be $t$-distributed (with $n_x - 1$ degrees of freedom) under the null.
You may notice that with the best available estimate of $\sigma$, $s_x$ used for $s_p$, this is exactly like the ordinary two-sample t-test formula with $n_y$ set to 1.
Edit:
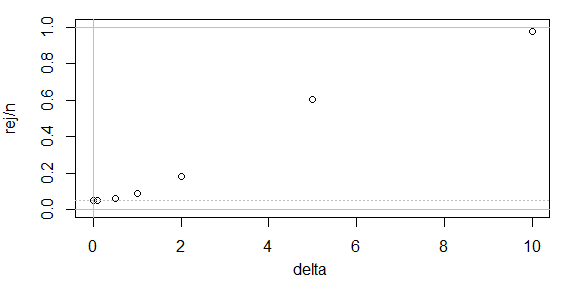
Here's a simulated power curve for this test. The simulation size at the null was 10000, at the other points was 1000. As you see, the rejection rate at the null is 0.05, and the power curve, while it requires a large difference in population means to have decent power, has the right shape. That is, this test does what it is supposed to.

(End edit)
With sample sizes so small, this will be somewhat sensitive to distributional assumptions, however.
If you're prepared to make different assumptions, or want to test equality of some other population quantity, some test may still be possible.
So all is not lost... but where possible, it's generally better to have at least some replication in both groups.
