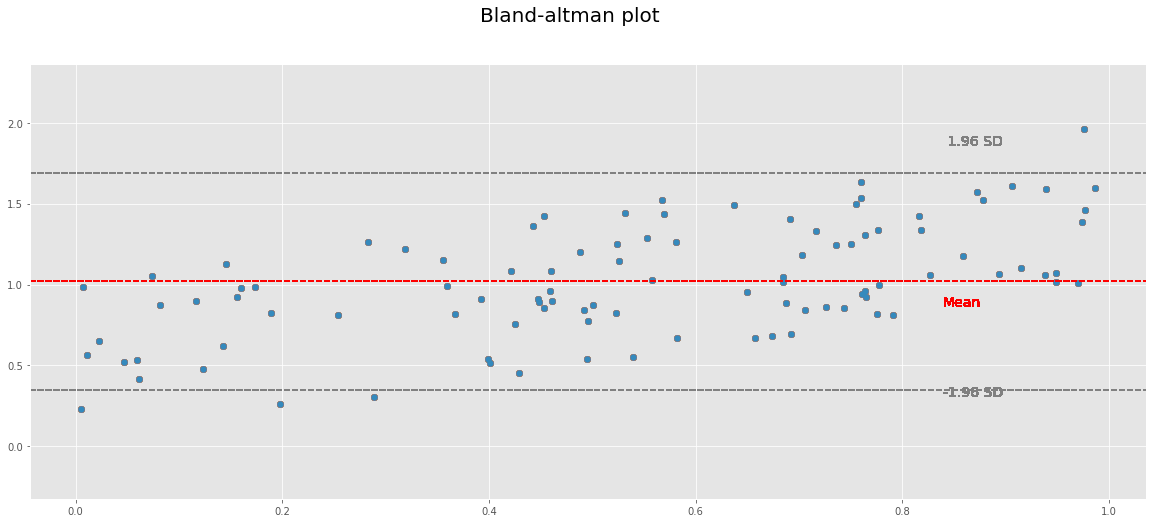
This is the Wikipedia definition of a Bland-Altman plot:
A Bland–Altman plot (difference plot) in analytical chemistry or biomedicine is a method of data plotting used in analyzing the agreement between two different assays. It is identical to a Tukey mean-difference plot1, the name by which it is known in other fields, but was popularised in medical statistics by J. Martin Bland and Douglas G. Altman
If you want to implement a Bland-Altman plot in Python you can use this:
If you would like to do this in Python you can use this code
import matplotlib.pyplot as plt
import numpy as np
from numpy.random import random
%matplotlib inline
plt.style.use('ggplot')
I just added the last line because I like the ggplot style.
def plotblandaltman(x,y,title,sd_limit):
    plt.figure(figsize=(20,8))
    plt.suptitle(title, fontsize="20")
    if len(x) != len(y):
        raise ValueError('x does not have the same length as y')
    else:
        for i in range(len(x)):
            a = np.asarray(x)

            b = np.asarray(x)+np.asarray(y)
            mean_diff = np.mean(b)
            std_diff = np.std(b, axis=0)
            limit_of_agreement = sd_limit * std_diff
            lower = mean_diff - limit_of_agreement
            upper = mean_diff + limit_of_agreement

            difference = upper - lower
            lowerplot = lower - (difference * 0.5)
            upperplot = upper + (difference * 0.5)
            plt.axhline(y=mean_diff, linestyle = "--", color = "red", label="mean diff")

            plt.axhline(y=lower, linestyle = "--", color = "grey", label="-1.96 SD")
            plt.axhline(y=upper, linestyle = "--", color = "grey", label="1.96 SD")

            plt.text(a.max()*0.85, upper * 1.1, " 1.96 SD", color = "grey", fontsize = "14")
            plt.text(a.max()*0.85, lower * 0.9, "-1.96 SD", color = "grey", fontsize = "14")
            plt.text(a.max()*0.85, mean_diff * 0.85, "Mean", color = "red", fontsize = "14")
            plt.ylim(lowerplot, upperplot)
            plt.scatter(x=a,y=b)
And finaly I just make some random values and compare them in this function
x = np.random.rand(100)
y = np.random.rand(100)
plotblandaltman(x,y,"Bland-altman plot",1.96)
With some minor modification, you can easily add a for-loop and make several plots

