You need an underlying model or metric by which one can describe 'sameness'. The quantitive description of data depends on the origin of the data.
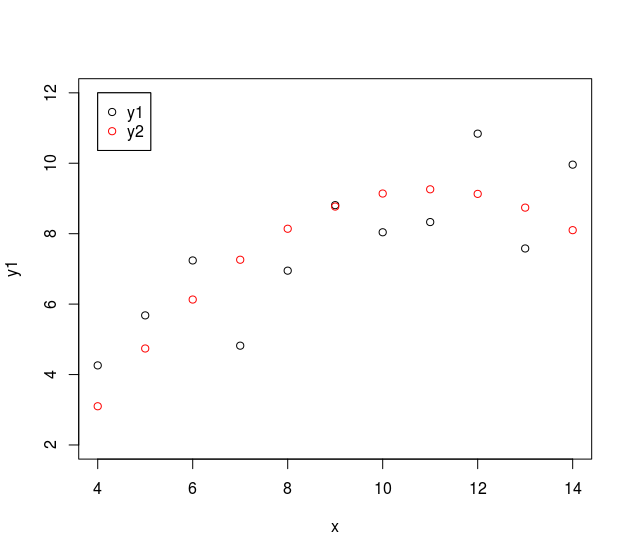
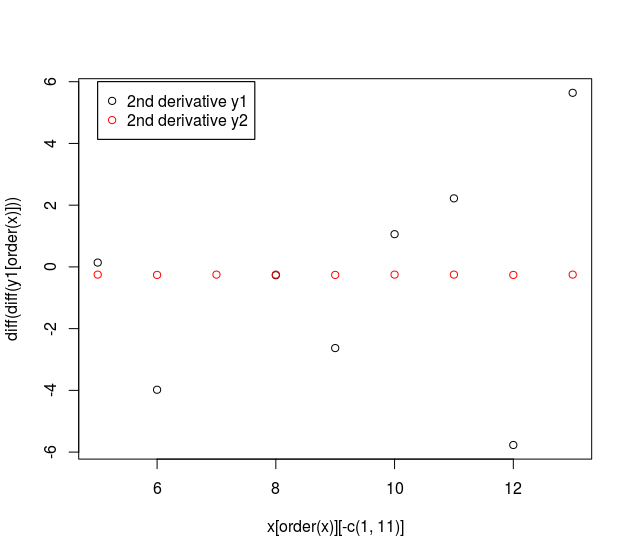
In this case it seems like (meaningless) fabricated data. The y2 values look like following a smooth curve without much noise. You can see this also in a plot of the 2nd order derivative (computed by taking the difference of the difference).
Whether this is relevant to you and whether measures like just correlation are meaningful or not, depends on your viewpoint and interpretation of the data.
But, if you have fabricated data then anything will be meaningless. So not much can be said about this particular case without context.
See more about the philosophy behind these graphs here: https://www.jstor.org/stable/2682899


