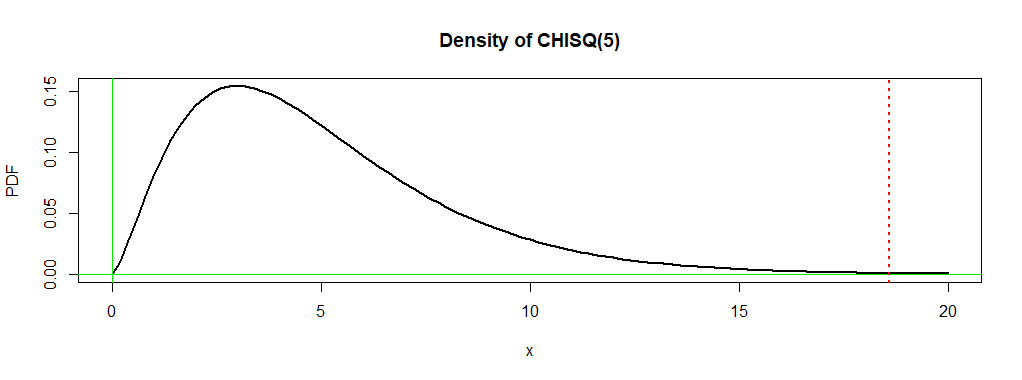
Continuing from my comment: On the assumption that disease categories are mutually exclusive, and
using an additional category None so that groups total $n_1 = 100, n_2 = 200,$
as stated, here is a chi-squared test of homogeneity (in R) of disease category
across groups.
G1 = c(20, 17, 13, 25,  5, 20)
G2 = c(56, 32, 40, 40, 20, 12)
TBL = rbind(G1, G2)
out = chisq.test(TBL);  our

        Pearson's Chi-squared test

data:  TBL
X-squared = 18.593, df = 5, p-value = 0.002288
The null hypothesis of homogeneity is rejected (P-value $0.0023).$
Observed counts $X_{ij}$ echo the input, expected counts $E_{ij}$ are based on row and column totals of the table (assuming homogeneity). For example, $E_{11} = 100(76/300) = 25.33333.$
The chi-squared statistic
(X-squared in output) is
$$ Q = \sum_{i=1}^2\sum_{j=1}^6 \frac{(X_{ij}-E_{ij})^2}{E_{ij}}=18.593,$$
which is distributed approximately as $\mathsf{Chisq}(\nu),$ where
the number of degrees of freedom is $\nu = (2-1)(6-1) = 5.$ The P-value is the probability
$0.0023$ under the density curve of $\mathsf{Chisq}(5)$ to the right of $18.593.$
In order for $Q$ to have this chi-squared distribution the $E_{ij}$s should exceed $5,$ which is true for your data.
out$obs
   [,1] [,2] [,3] [,4] [,5] [,6]
G1   20   17   13   25    5   20
G2   56   32   40   40   20   12
out$exp
       [,1]     [,2]     [,3]     [,4]      [,5]     [,6]
G1 25.33333 16.33333 17.66667 21.66667  8.333333 10.66667
G2 50.66667 32.66667 35.33333 43.33333 16.666667 21.33333
out$res
         [,1]       [,2]      [,3]       [,4]       [,5]      [,6]
G1 -1.0596259  0.1649572 -1.110272  0.7161149 -1.1547005  2.857738
G2  0.7492686 -0.1166424  0.785081 -0.5063697  0.8164966 -2.020726
The Pearson residuals are the square roots of the the $rc = 12$ contributions $C_{ij} = \frac{(X_{ij}-E_{ij})^2}{E_{ij}},$ given the signs of the differences $D_{ij} = X_{ij}-E_{ij}.$
Residuals with the largest absolute values point the way to the contributions
most responsible for a large enough value $Q$ to lead to rejection.
Here the key residuals are for the category None, so number of G1 subjects
not having one of the five diseases is larger than expected if categories were
homogeneous across groups. Otherwise, disease categories 1 and 5 seem different
among the groups.
Separate ad hoc tests (perhaps at the 1% level to avoid 'false discovery' according to the Bonferroni method), would show which differences are significant.

