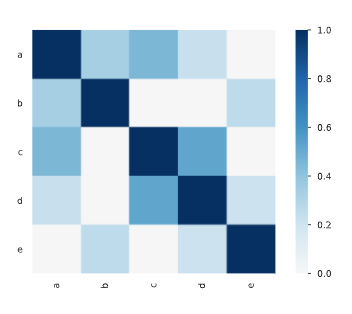
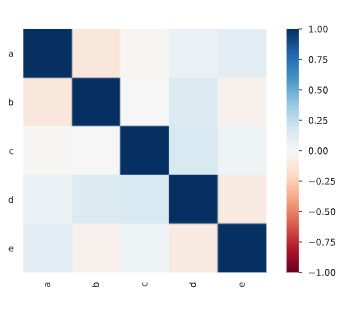
I am trying to put my head around the Phi_k ($\phi_k$) correlation parameter presented by Baak et al.. Is it possible to define it in a closed-form? I think not because it is an algorithm rather than a formula. Besides, it is not clear if the results of $\phi_k$ are not sensitive to noise in the data.
They let $x$ and $y$ be two random variables where $\bar{x}, \bar{y}, \sigma_{x}, \sigma_{y}$ are their means and standard deviations, respectively. They denote the well-known Pearson correlation as $\rho$.
They state that the following relationship between $\rho$ and a bi-variate normal distribution $f_{\text {b.n.}}$ holds:
$f_{\text {b.n. }}\left(x, y \mid \bar{x}, \bar{y}, \sigma_{x}, \sigma_{y}, \rho\right)=$ $$ \frac{1}{2 \pi \sigma_{x} \sigma_{y} \sqrt{1-\rho^{2}}} \exp \left(-\frac{1}{2\left(1-\rho^{2}\right)}\left[\frac{(x-\bar{x})^{2}}{\sigma_{x}^{2}}+\frac{(y-\bar{y})^{2}}{\sigma_{y}^{2}}-\frac{2 \rho(x-\bar{x})(y-\bar{y})}{\sigma_{x} \sigma_{y}}\right]\right) $$
They let $F_{i j}$ be the integral of the bi-variate normal distribution over an area: $$F_{i j}(\rho)=\int_{\text {area }_{i j}} f_{\text {b.n. }}(x, y \mid \rho) \mathrm{d} x \mathrm{~d} y$$
The maximum possible value of the contingency test is: $\chi_{\max }^{2}(N, r, k)=N \min (r-1, k-1)$, which depends only on the number of records $N$, rows $r$, and columns $k$, and is reached when there is a one-on-one dependency between the two variables.
To account for statistical noise, they introduce a sample-specific pedestal (what's pedestal) $n_{\text {sdof }}$: $n_{\text {sdof }}=(r-1)(k-1)-n_{\text {empty }}(expected)$ with number of rows $r$ and columns $k,$ and where $n_{\text {empty }}(expected)$ is the number of empty bins of the dependent frequency estimates of the sample. The pedestal is defined as: $$ \chi_{\mathrm{ped}}^{2}=n_{\mathrm{sdof}}+c \cdot \sqrt{2 n_{\mathrm{sdof}}} $$
$\chi_{\text {b.n. }}^{2}(\rho, N, r, k)=N \sum_{i, j}^{k, r} \frac{\left(F_{i j}(\rho=\rho)-F_{i j}(\rho=0)\right)^{2}}{F_{i j}(\rho=0)}$
$X_{\mathrm{b.n.}}^{2}(\rho, N, r, k)=\chi_{\mathrm{ped}}^{2}+\left\{\frac{\chi_{\max }^{2}(N, r, k)-\chi_{\mathrm{ped}}^{2}}{\chi_{\mathrm{b.n.}}^{2}(1, N, r, k)}\right\} \cdot \chi_{\mathrm{b.n.}}^{2}(\rho, N, r, k)$
We can now perform the necessary steps to obtain the correlation coefficient $\phi_{K}$ :
- In case of unbinned interval variables, apply a binning to each one. A reasonable binning is generally use-case specific. As a default setting we take 10 uniform bins per variable.
- Fill the contingency table for a chosen variable pair, which contains $N$ records, has $r$ rows and $k$ columns.
- Evaluate the $\chi^{2}$ contingency test using the Pearson's $\chi^{2}$ test statistic ($\chi^{2}=\sum_{i, j} \frac{\left(O_{i j}-E_{i j}\right)^{2}}{E_{i j}}$) and the statistically dependent frequency estimates.
- Interpret the $\chi^{2}$ value as coming from a bi-variate normal distribution without statistical fluctuations.
- If $\chi^{2}<\chi_{\text {ped }}^{2},$ set $\rho$ to zero.
- Else, with fixed $N, r, k,$ invert the $X_{\mathrm{b.n.}}^{2}$ function, $e . g .$ using Brent's method, and numerically solve for $\rho$ in the range [0,1] .
- The solution for $\rho$ defines the correlation coefficient $\phi_{K}$. The procedure can be extended to more variables by using a multi-variate Gaussian instead of a bi-variate one.
When I create some simple 100x5 of random data there is some correlation between c and d in the dataframe which is not intuitive to me and the Pearson correlation suggest it is not a real correaltion.
df = pd.DataFrame(
    np.random.rand(100, 5),
    columns=["a", "b", "c", "d", "e"]
)


