There are a few things one should be aware of.
Like most internal clustering criterions, Calinski-Harabasz is a heuristic device. The proper way to use it is to compare clustering solutions obtained on the same data, - solutions which differ either by the number of clusters or by the clustering method used.
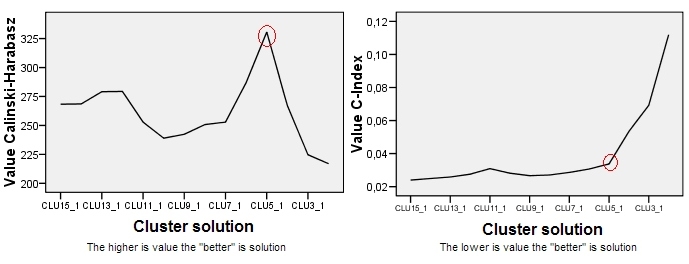
There is no "acceptable" cut-off value. You simply compare CH values by eye. The higher the value, the "better" is the solution. If on the line-plot of CH values there appears that one solution give peak or at least abrupt elbow, choose it. If, on the contrary, the line is smooth - horizontal or ascending or descending - then there is no reason to prefer one solution to others.
CH criterion is based on ANOVA ideology. Hence, it implies that the clustered objects lie in Euclidean space of scale (not ordinal or binary or nominal) variables. If the data clustered were not objects X variables but a matrix of dissimilarities between objects then the dissimilarity measure should be (squared) euclidean distance (or, at worse, other metric distance approaching euclidean distance by properties).
CH criterion is most suitable in case when clusters are more or less spherical and compact in their middle (such as normally distributed, for instance). Other conditions being equal, CH tends to prefer cluster solutions with clusters consisting of roughly the same number of objects.
Let's observe an example. Below is a scatterplot of data that were generated as 5 normally distributed clusters which lie quite close to each other.

These data were clustered by hierarchical average-linkage method, and all cluster solutions (cluster memberships) from 15-cluster through 2-cluster solution were saved. Then two clustering criterions applied to compare the solutions and to select the "better" one, if there is any.

Plot for Calinski-Harabasz is on the left. We see that - in this example - CH plainly indicates 5-cluster solution (labelled CLU5_1) as the best one. Plot for another clustering criterion, C-Index (which is not based on ANOVA ideology and is more universal in its application than CH) is on the right. For C-Index, lower value indicates "better" solution. As the plot shows, 15-cluster solution is formally the best. But remember that with clustering criterions rugged topography is more important in decision than the magnitude itself. Note there is the elbow at 5-cluster solution; 5-cluster solution is still relatively good while 4- or 3-cluster solutions deteriorate by leaps. Since we usually wish to get "a better solution with less clusters", the choice of 5-cluster solution appears to be reasonable under C-Index testing, too.
P.S. This post also brings up the question whether we should trust more the actual maximum (or minimum) of a clustering criterion or rather a landscape of the plot of its values.
