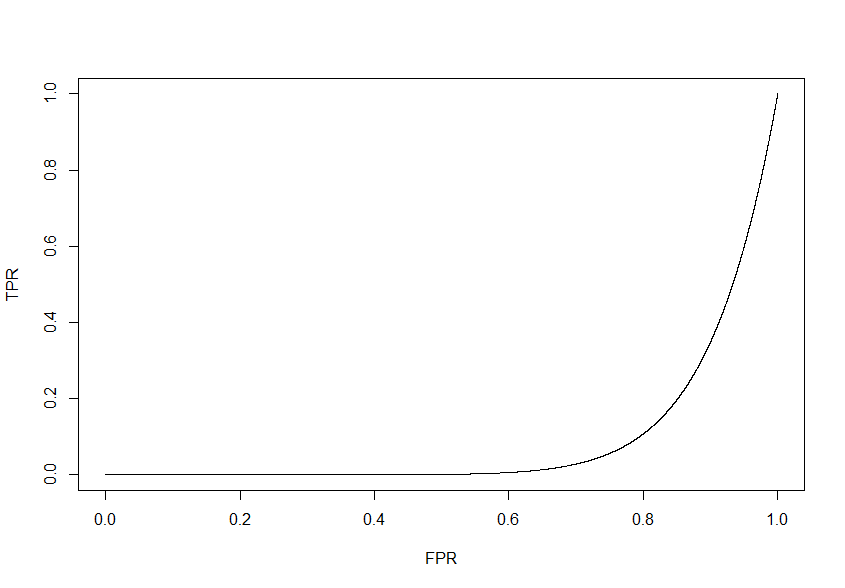
There's nothing more practical than a good theory! You need to graph TPR against FPR (for example, for $t=0.1$, $TPR=0.81$ and $FPR=0.98$, this gives you one point of the graph). The image below takes 1,000 points resulting from giving 1,000 different values to $t$
Then you can calculate the area under the curve as an integral. Since we're not likely to have an expression for the curve we've plotted, we should try to approximate it.
In this specific example, we can indeed get

