I have repeated measures for a large number of variables and about a hundred individuals.
These measures are repeated to assure reproducibility and are not longitudinal time points.
I want to provide summaries and/or plots for these variables, but any calculation across the whole column (even weighted on the number of measures per individual) would lose the important information of the intra-individual variance.
On the other hand, presenting grouped data for this many individuals is not realistic.
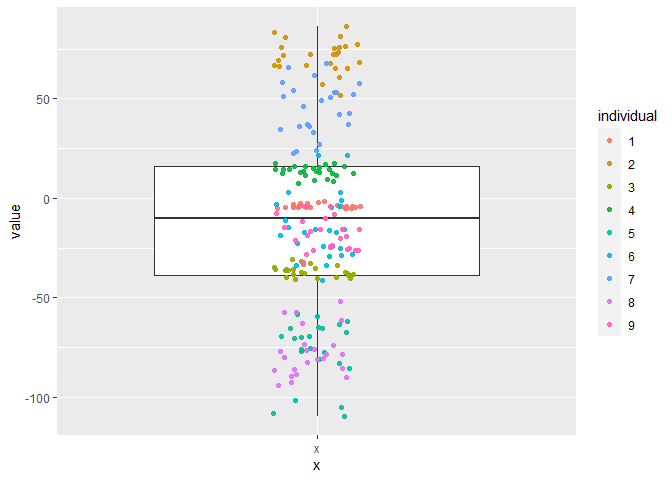
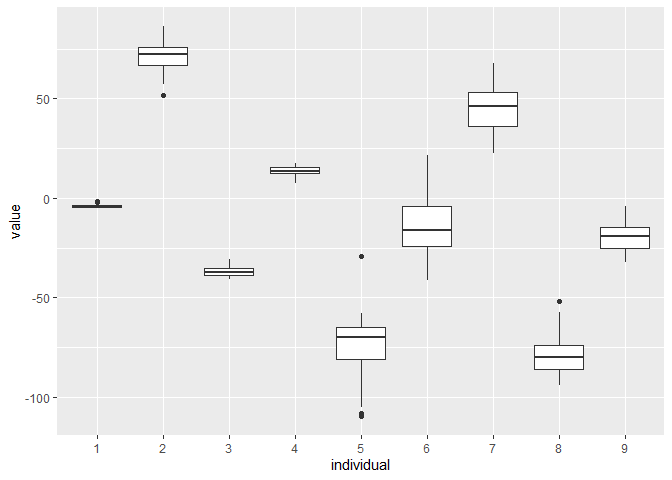
Here is a simulation on 9 individuals of the unsatisfying plots I have so far. Both are not scalable with a lot of individuals.
library(tidyverse)
N1=9 #individuals
N2=25 #measures
#for each N1 individuals, take N2 values based on a specific mean and variance (both from a normal distribution)
df = expand.grid(individual=factor(1:N1), measure=LETTERS[1:N2]) %>%
  arrange(individual) %>%
  group_by(individual) %>%
  mutate(
    base_mean = rnorm(1, 0, 50),
    base_var = abs(rnorm(1, 0, 10)),
    value = rnorm(n(), base_mean, base_var),
  ) %>%
  identity()

#draw 1 boxplot with individuals as colors
ggplot(df, aes(x="x", y=value)) +
  geom_boxplot() +
  geom_jitter(aes(color=individual), width=0.1, alpha=0.9)

#draw 1 boxplot per individual
ggplot(df, aes(x=individual, y=value)) +
  geom_boxplot()

Created on 2021-09-18 by the reprex package (v2.0.0)
Is there a way to visualize or summarise the data on both intra- and inter-individual levels?
