TL;DR: How to evaluate effect of variable on (bimodal) outcome?
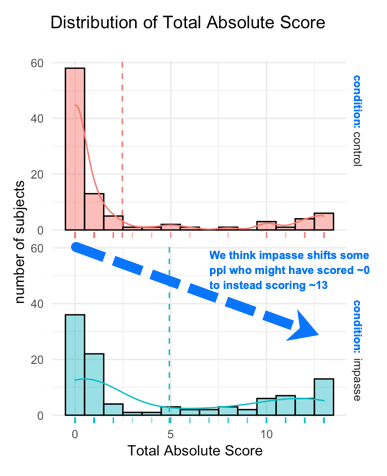
Context Please see below a faceted histogram of the outcome variable (Total Absolute Score) of a recent experimental (psych) study. The outcome variable (Total Absolute Score) indicates the number of correctly answered questions on a graph-reading task (ranges from 0 to 13; score on a sequence of 13 questions). The faceting variable (condition) refers to the 2 experimental conditions in the study (control vs. impasse)
Data Generating Process The task that generates the Total Absolute Score measures understanding of a novel graph. In past studies we've found that most readers either can complete the task accurately from the beginning of the task onwards (i.e. the high scores at the far right of the graph) or (more often) cannot do it at all(the low scores at the left of the graph). Very few subjects figure out how to correctly answer the questions halfway through the task (scores in the middle; indicating some Qs answered incorrectly and some correctly [in that order]). The experimental condition (impasse) is designed to improve performance by shifting people from 'not understanding' to 'understanding'.
The Problem: Given the very-not-normally-distributed nature of this distribution, what is an appropriate analysis strategy to quantify any effect of condition on score?
My intuition regarding the actual data generating process at play is that Condition does have an effect on Score, by making some subjects more likely to understand the graph from the beginning of the task (and thus yield a score ~13). Importantly, this understanding does not yield intermediary scores; a person generally 'gets it' on the first few questions, or doesn't get it at all. Essentially, we think that condition works by 'shifting some of the mass' from the low-end of the distribution to the high end. Is there a way to model and quantify this?
A simple linear regression predicting Total Absolute Score from Condition explains ~ 7% variance in score, (with a significant p-value for Condition). But of course the residuals for this model are not normally distributed, and it's an awful fit. The predictions that are made (i.e. dashed lines representing mean of each group) are closer to the least frequent values in each histogram than they are to the modal values.
Other things I've read a little about: (1) Hurdle model? Separately model binary probability of getting 0 score or greater than 0 score AND then probability of the count # of correct Qs. This seems like an intuitive fit for the hypothesized DGP, BUT I'm not certain if its appropriate to treat # of questions correct on an exam as a count variable? (2) Modelling at the question rather than subject level? So the outcome is 0 or 1, but would also need to account for sequence of items (logistic mixed effects model? predicting accuracy [correct/incorrect] by condition + subject + question?
Any advice & pointers to readings / tutorials are much appreciated! I have a 3 studies with this task that show the same pattern of the results.
UPDATE (To answer Qs that have been asked) : The data are from a between-subjects (crossed) study, so the groups are independent, not paired. I do have scores (0,1) at the item level, but this distribution is for the total score (sum across all items for each subject).

