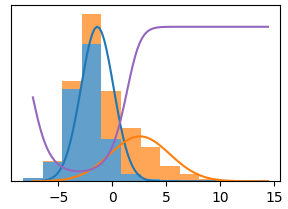
I'm using scipy's optimize to fit two Gaussian distributions to my data. I expected the posterior likelihood of belonging to the rightmost class to start from 0 before the distributions cross, and go to 1 from that point.
However, the output looks like this,

so the probability of belonging to the second class is high on both sides of the peaks.
I tried to reproduce this behaviour with the parameters of the two distributions:
import matplotlib.pyplot as plt;
import scipy.stats as stats;
import numpy as np;

params1 = [ 1.68, 2.13 ];
params2 = [ -.81, 1.22 ];

x  = np.linspace ( -5, 15, 100);
y1 = stats.norm.pdf ( x, params1[0], params1[1] );
y2 = stats.norm.pdf ( x, params2[0], params2[1] );
y3 = y1 / y2; y3 = y3 / ( 1 + abs ( y3 ) );

plt.plot ( x, y1, x, y2, x, y3 * .33 );
plt.show();
so the problem is that if the right distribution has a heavier tail than the left, and the posterior probability is defined by the ratio (or sign of difference) of the two densities, it will be higher for the right distribution on the left side (as well as on the right).
Is there a way to overcome this in Gaussian mixture modelling? Should I use a different fit function, or modify the inputs?
