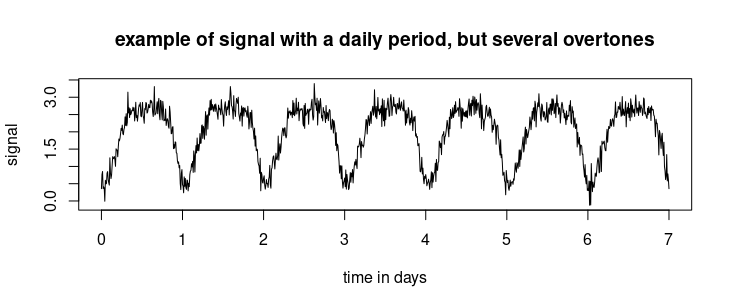
TLDR; The signal period is $24$ hours, eventhough you have your power spectrum indicating components with a smaller period. The signals with period $6, 8, 12$ hrs also repeat themselves every $4 \cdot 6, 3 \cdot 8, 2 \cdot 12$ hrs. So they all have, in a way, a common period of 24 hrs.
It gives me four seasonal patterns at periods of 24, 12, 08, and 06
This sounds like you get overtones. If your periodogram is a sort of Fourier spectrum, then this is not weird. It means that the daily pattern consists of more structure than just a single sine wave.
This doesn't mean that the period of the signal is smaller than 1 day. Below is an example signal constructed with several overtones (wave lengths smaller than 1 day), and you can see that the period of the signal is 1 day. The higher frequency signals influence the shape but not the period of the signal.
The period of a function that is a sum of periodic functions is the least common multiple of the periods of the functions in the sum.
### t is time for one week of data sampled every ten minutes
t = seq(0,7*24*60,10)

### some example measurement of data that depends on sin waves with multiple sub-daily periods
Td = (24*60)/(2*pi)  ### daily period
y = 2 + sin((t+1000)/(Td)) + 0.4* sin((t+1200)/(Td/2)) + 0.1* sin((t+800)/(Td/3)) + 0.1* sin((t+1000)/(Td/4))

### plot
plot(t/24/60,y+rnorm(7*24*6,0,0.2),
     type = "l", xlab = "time in days", ylab = "signal",
     main = "example of signal with a daily period, but several overtones")

