Running your code with minor fixes
product <- structure(list(date = c("2022-11", "2022-10", "2022-09", "2022-08",
                        "2022-07", "2022-06"),
                        production_brute_nucleaire =
                 c(22951.429,

                   21465.026, 19334.531, 19319.365, 19923.664, 21275.248)), row.names = c(NA,

                                                                                          6L), class = "data.frame")
str(product)

library(recipes)
rec <- recipe(~., data = product)
bc_trans <- step_BoxCox(rec, all_numeric())
bc_estimates <- prep(bc_trans, training = product)
bc_data <- bake(bc_estimates, product)
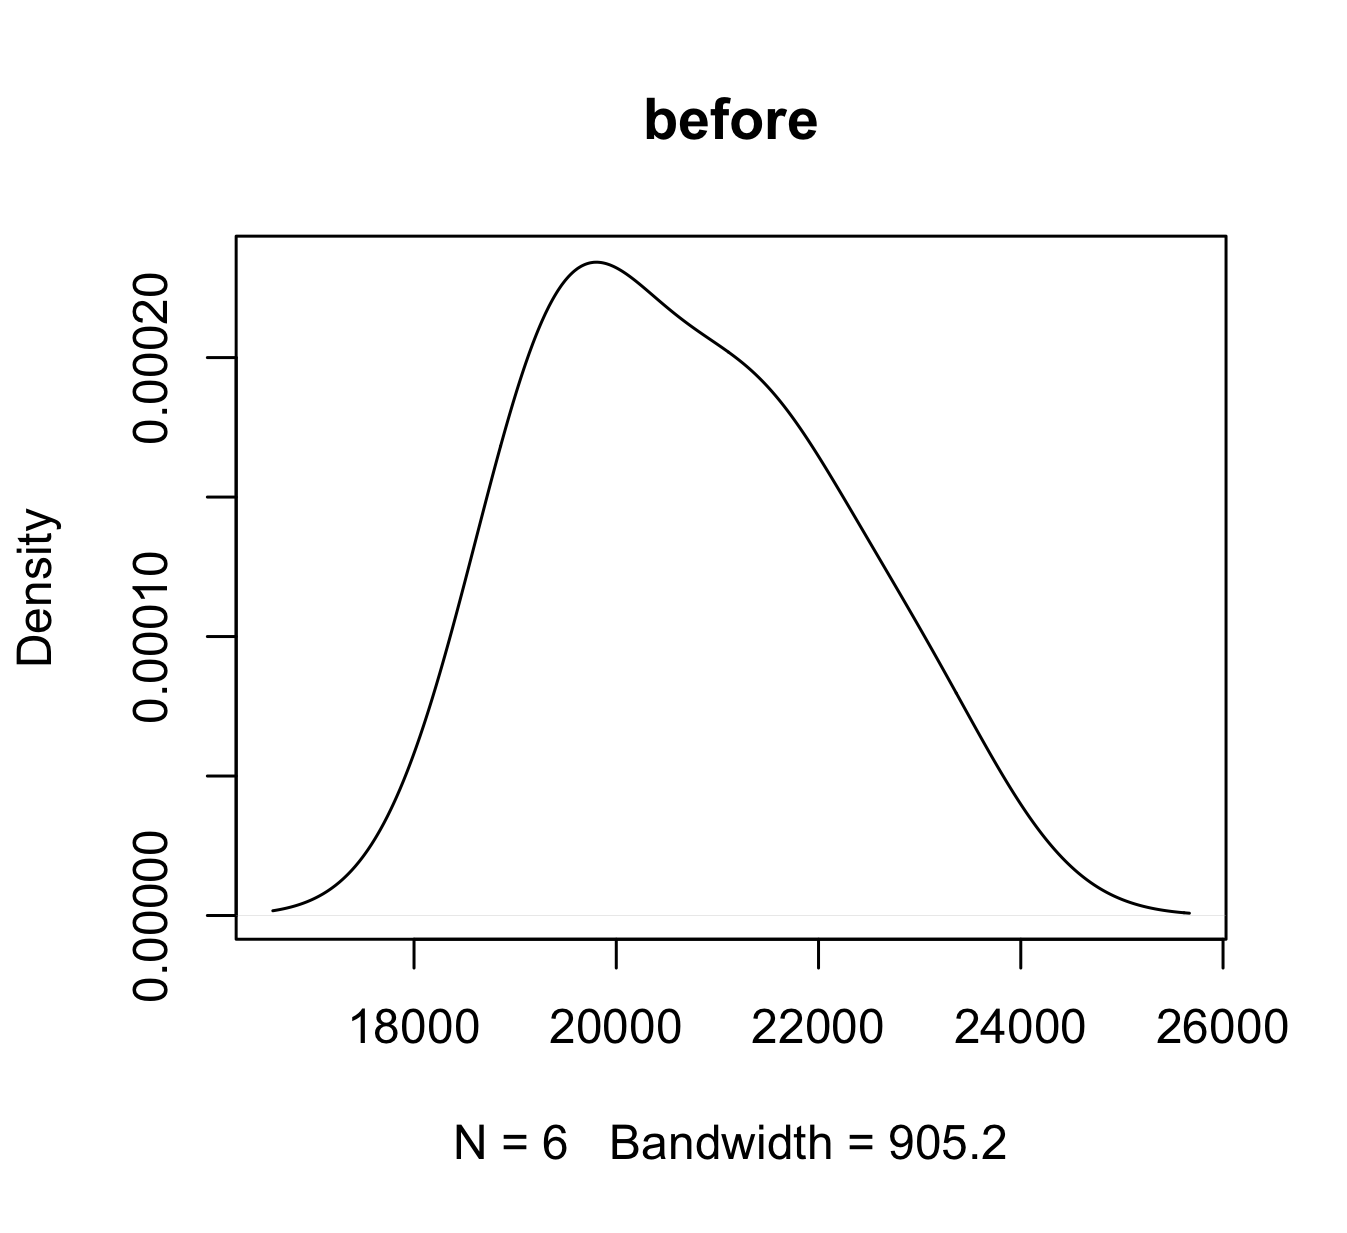
plot(density(product$production_brute_nucleaire), main = "before")
gives this

