Accepted answer is good, but I think there is more to this. It describes a case with cross-entropy loss, but MNIST can be learned with 87% accuracy even with MSE loss.
Here are example digit patterns learned with MSE loss:

Dot-product input image with all of these patterns, and the biggest dot-product will determine our digit class.
However, those patterns are trained with binarized (0 or 1) pixels, no floating point values. When two patterns in dot-product are binarized, dot-product effectively calculates "common area", the number of 1-pixels which are shared in both vectors. The fact that this "comparing common area" method achieves 87% accuracy implies that images in one class in MNIST dataset overlap a lot.
Still, when we check "average" images for each digit class, they are far from these patterns:
These patterns (just means) achieve 64% accuracy on MNIST test set! If I center the pixel values (subtract 0.2 from pixel values), I get 75% accuracy. This is a big argument for "shared area" explanation.
Why original patterns differ so much from mean images, if we compare areas? The reason is that we should calculate weighted average, when in-class images get more weight than images out-class. One easy idea is to weight -1 all out-of-class images, and +1 all in-class images. But because we have more out-of-class images, this will make affect our patterns too negatively for out-of-class, so instead let's do
-mean(out-of-class digits) + mean(in-class digits)
Here are mean(out-of-class digits), yes so similar:

and here is difference with mean(in-class digits):

Now these patterns look very similar to those from accepted answer, learned with cross-entropy loss!
But we still didn't reproduce original learned patterns. This is because we have chosen very simple weighted means (-1 out-of-class, +1 in-class). In reality each data point (training digit) gets it's own weight coefficient.
Weight coefs for class-0 MNIST digits are: -0.1645, 0.1290, 0.1497, 0.0644, -0.0883, -0.0078, 0.1196, -0.1105, 0.0919, 0.1153, ...
If I add sum MNIST digits using those weights, I get (each image is weighted running sum):

Last weight coeffs are: ..., 0.2693, -0.0031, -0.0041, -0.0511, -0.4518, 0.0176, 0.0539, -0.0661, 0.0607, -0.1115. Last running image sums:
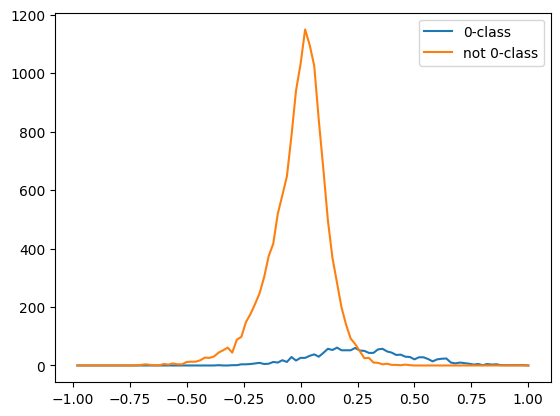
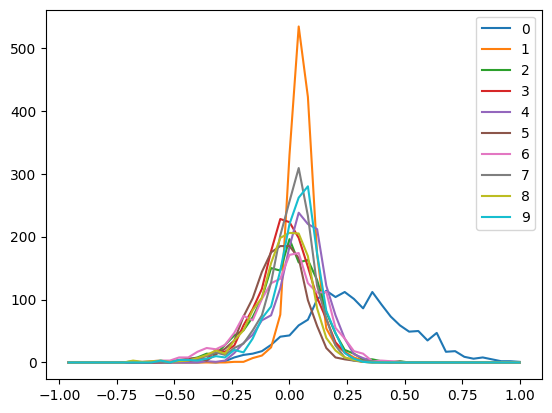
In the end we arrive to original pattern of "0-class", which I posted at the beginning. The coefficients are not always negative for out-of-clas and positive for in-class. Here are distributions of weight coefs values. In-class (in this case, for 0-class) are centered around +0.25, while out-of-class are centered around 0:
Bottom line of this: MNIST test digits have a lot of pixel-wise overlap with MNIST train digits. We can figure out digit class by calculating weighted sum of shared areas (shared with training digits). MSE loss learns exactly these patterns, but without calculating weighted coefs directly.
Sometimes it helps to think about this as "just patterns" :)
Coefficients can be calculated by solving MNIST as system of linear equations, as described in here.


