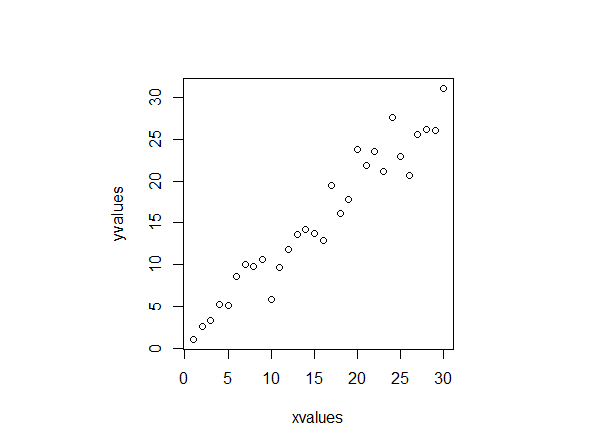
This is a plot of my data

These are the values:
   xvalues  yvalues
1   1.091186
2   2.653722
3   3.309146
4   5.206479
5   5.115582
6   8.537005
7   10.013147
8   9.802291
9   10.667769
10  5.809750
11  9.624475
12  11.806013
13  13.587066
14  14.146781
15  13.707472
16  12.891355
17  19.435301
18  16.122108
19  17.768536
20  23.813027
21  21.819081
22  23.556074
23  21.170983
24  27.621148
25  22.932580
26  20.704689
27  25.530339
28  26.227371
29  26.051016
30  31.047145
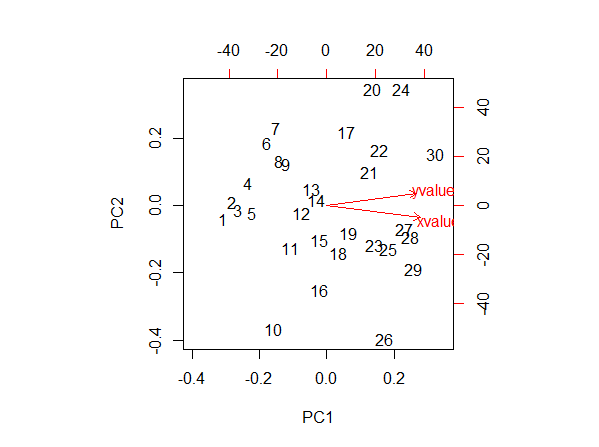
I now do a PCA and a biplot of it:

According to Jeromy Anglim in: Interpretation of biplots in principal components analysis
The left and bottom axes are showing the loadings; the top and right axes are showing principal component scores.
The left and bottom axes are showing [normalized] principal component scores; the top and right axes are showing the loadings.
I want to be sure I really get this.
Let's start with the loadings: these can be visualized in R by writing:
results <- prcomp(your_data)
results$rotation

          PC1        PC2
xvalues   0.7235616  -0.6902599
yvalues   0.6902599   0.7235616

summary(results)

Importance of components:
                       PC1     PC2
Standard deviation     12.0747 1.56606
Proportion of Variance  0.9835 0.01654
Cumulative Proportion   0.9835 1.00000
Now lets look at the red arrow of xvalues. Its tip is around 0.25 in the x-axis of the loadings. But according to the loadings I have just writen, it should be around 0.72. What am I missing?
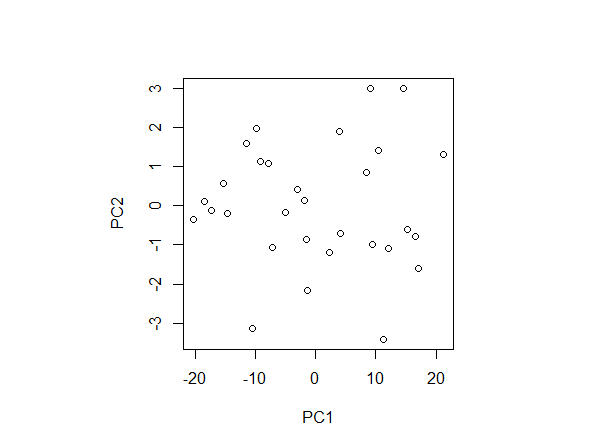
Finally, lets look at the point 1. According to the axes, that is telling me the principal component score. Is it that the coordinate in the new frame of reference? It doesn't make sense to me because I think that the new origin of the axes is around the point (15,15) in the Plot 3. If I look at that (and I guess that I am completely wrong here), the point one should have a coordinate around -20 or so, and not 40. Where is my mistake?
Update
I tried plotting this:
plot(pca_results$x)

Here it can be seen that the first point has the coordinate that I thought it had to have. But, still, what are the units in the biplot then??
