I am fitting a linear model to a problem, and a little confused by what is going on. Without the details here are the two plots confusing me:
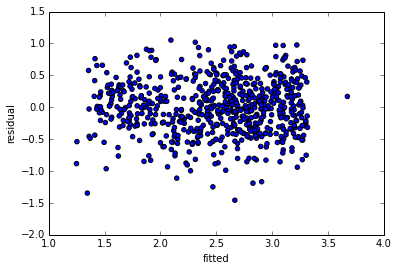
Residuals vs Fitted

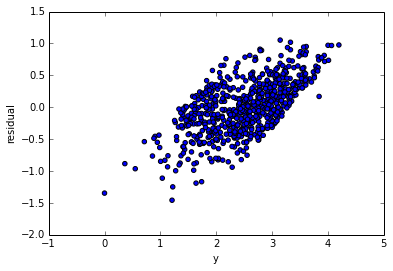
Residuals vs Y

Now the residuals vs fitted looks good to me. Fairly evenly dispersed, no clear pattern. However, the $y$ vs fitted do not look good. I would have expected there to also not be a clear trend in this relationship.
This seems basic, but I'm rather lost. I don't want to fit a model that allows large positive errors at high values of $Y$ to make up for large negative errors at low values of $Y$.
Is this just an indication of a poorly fitting model? Or is something else going on here?
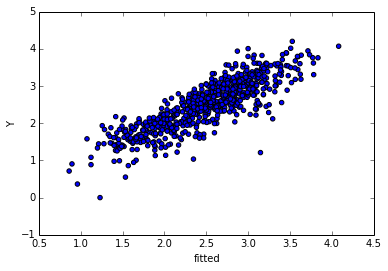
EDIT: Asked for fitted vs y (changed to have labels)

