For comparing variances, Wilcox suggests a percentile bootstrap method. See chapter 5.5.1 of 'Introduction to Robust Estimation and Hypothesis Testing'. This is available as comvar2 from the wrs package in R.
edit: to find the amount of bootstrap differences to trim from each side for different values of $\alpha$, one would perform a Monte Carlo study, as suggested by Wilcox. I have a quick and dirty one here in Matlab (duck from thrown shoes):
randn('state',0);           %to make the results replicable.
alphas = [0.001,0.005,0.01,0.025,0.05,0.10,0.15,0.20,0.25,0.333];
nreps  = 4096;
nsizes = round(2.^ (4:0.5:9));
nboots = 599;
cutls  = nan(numel(nsizes),numel(alphas));

for ii=1:numel(nsizes)
    n = nsizes(ii);
    imbalance = nan(nreps,1);
    for jj=1:nreps
        x1 = randn(n,1);x2 = randn(n,1);
        %make bootstrap samples;
        x1b = x1(ceil(n * rand(n,nboots)));
        x2b = x2(ceil(n * rand(n,nboots)));
        %compute stdevs
        sig1 = std(x1b,1);sig2 = std(x2b,1);
        %compute difference in stdevs
        Dvar = (sig1.^2 - sig2.^2);
        %compute the minimum of {the # < 0} and {the # > 0}
        %in (1-alpha) of the cases you want this minimum to match
        %your l number; then let u = 599 - l + 1
        imbalance(jj,1) = min(sum(Dvar < 0),sum(Dvar > 0));
    end
    imbalance = sort(imbalance);
    cutls(ii,:) = interp1(linspace(0,1,numel(imbalance)),imbalance(:)',alphas,'nearest');
end
%plot them;
lh = loglog(nsizes(:),cutls + 1);
legend(lh,arrayfun(@(x)(sprintf('alpha = %g',x)),alphas,'UniformOutput',false))
ylabel('l + 1');
xlabel('sample size, n_m');
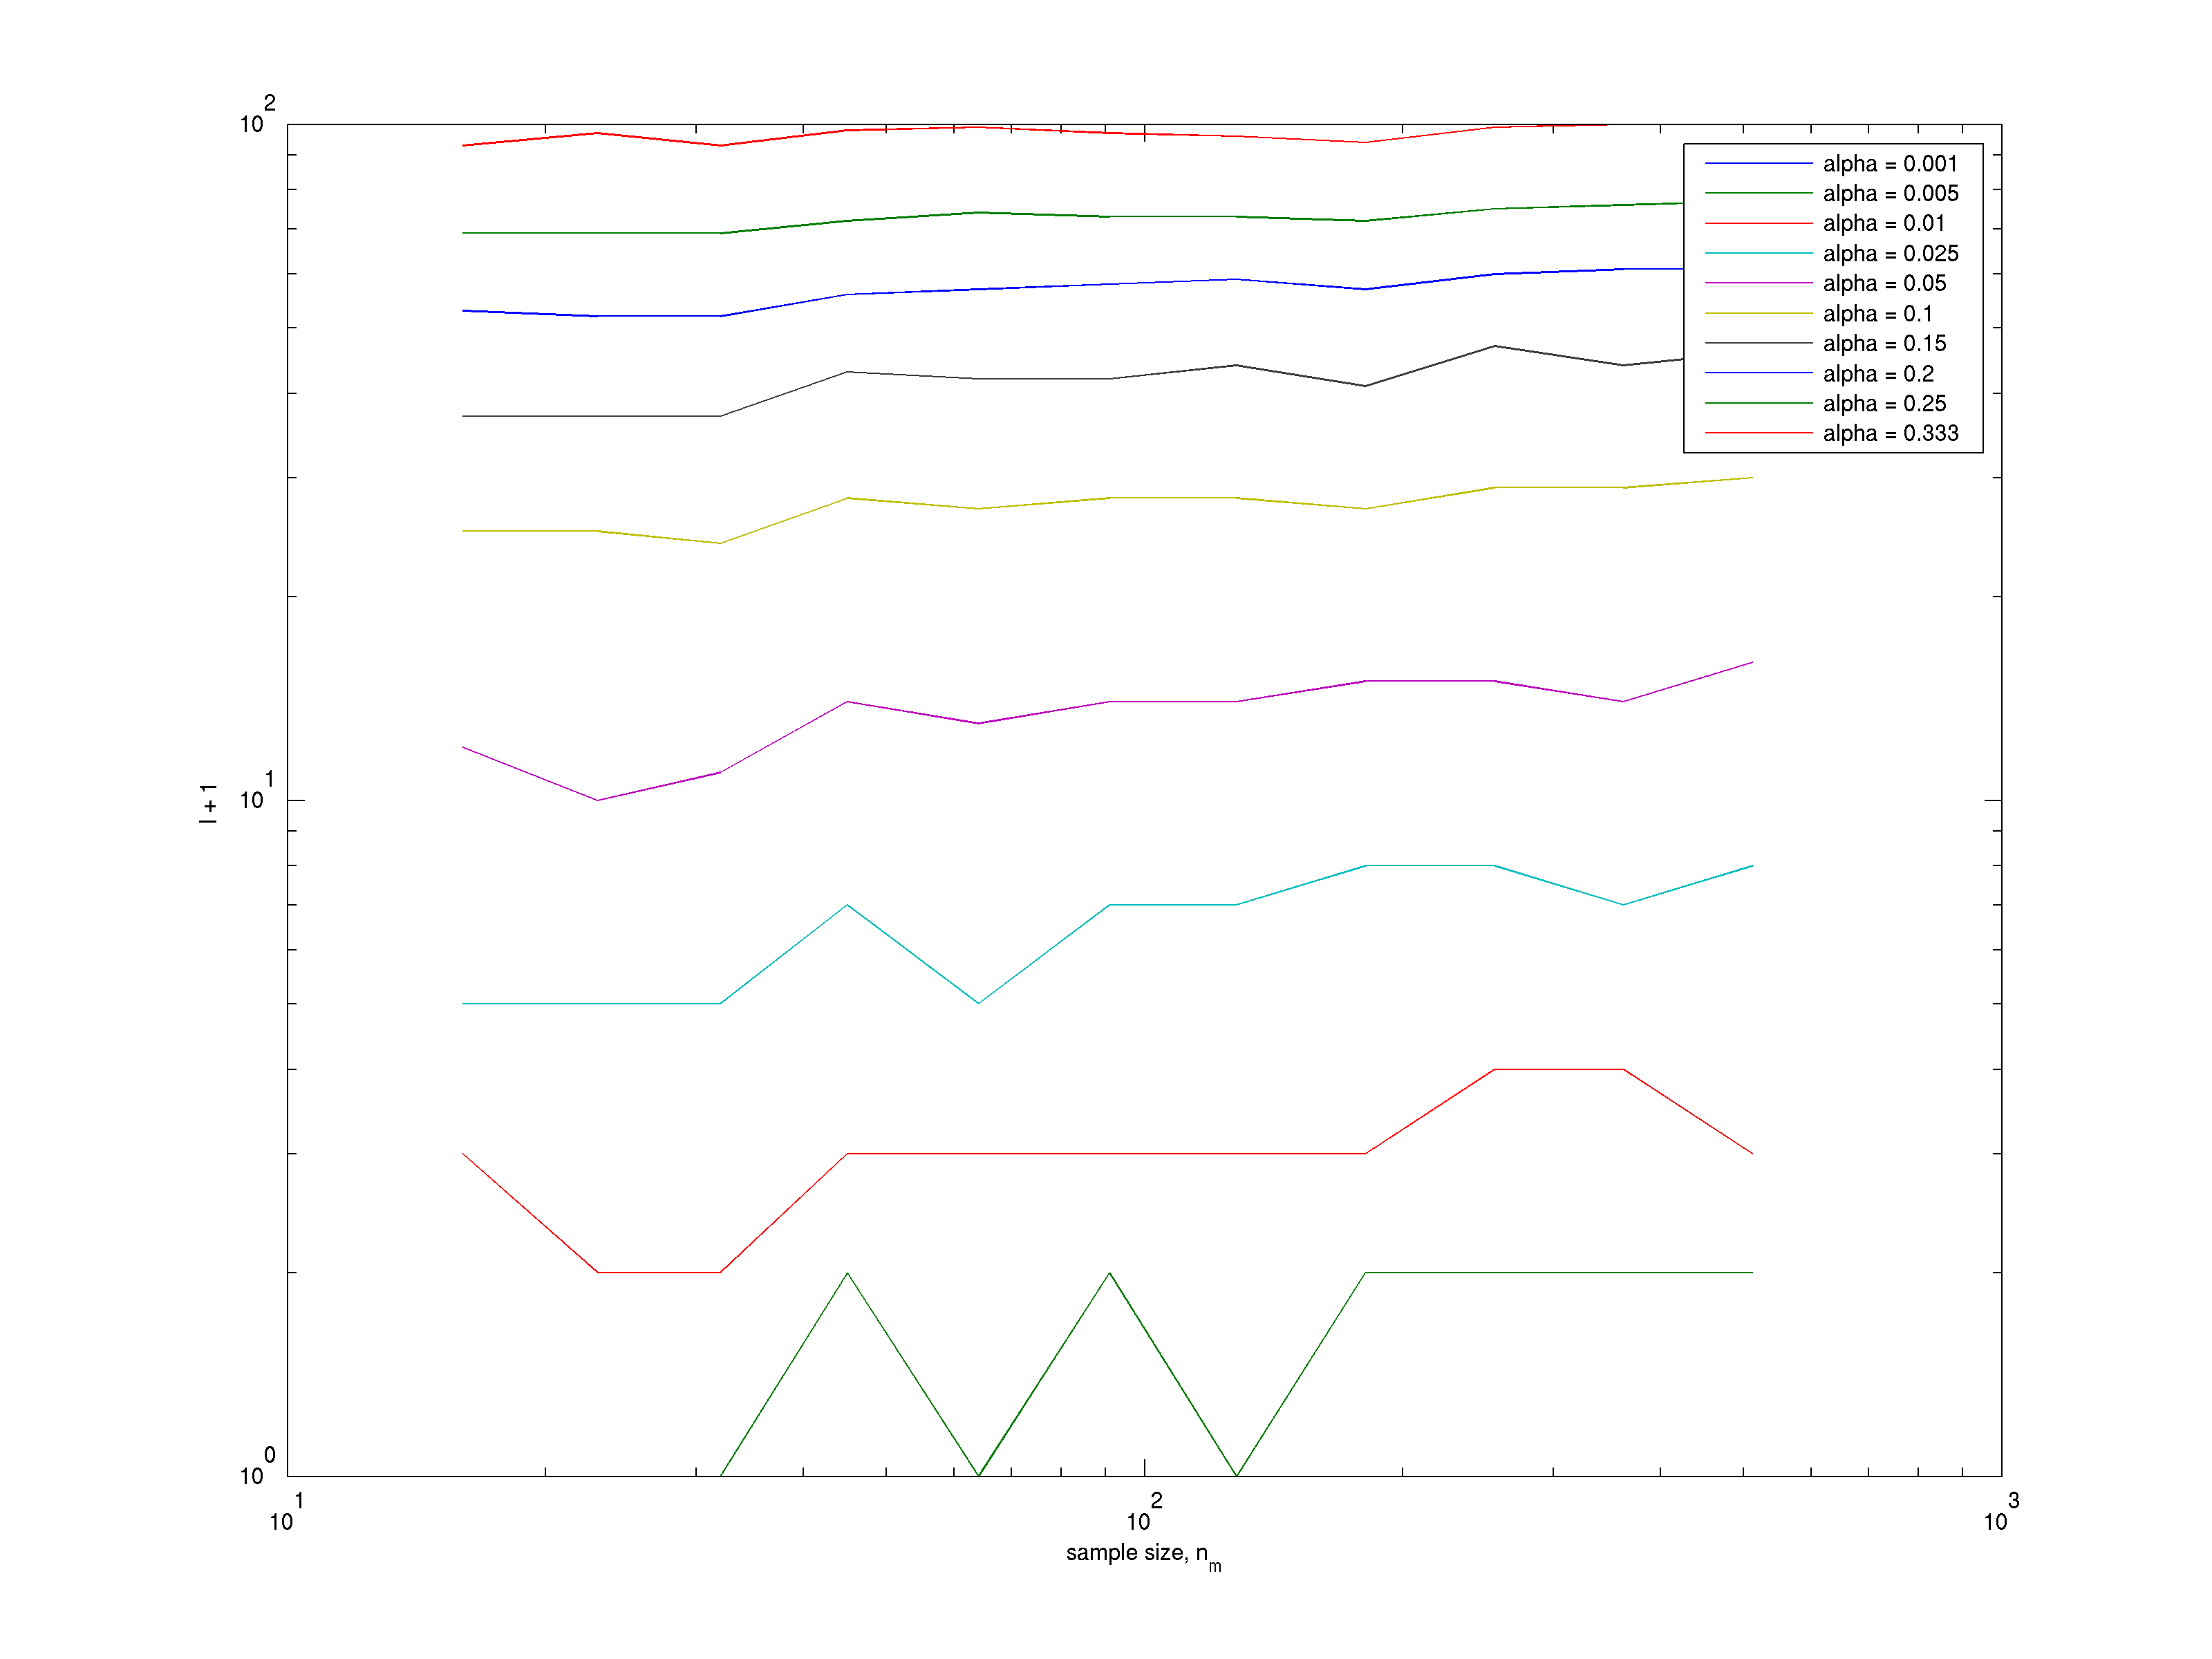
I get the rather unhelpful plot:

A little bit of hackery indicates that a model of the form $l + 0.5 = \exp{5.18} \alpha^{0.94} n^{0.067}$ fits my Monte Carlo simulations fairly well, but they do not give the same results that Wilcox quotes in his book. You might be better served running these experiments yourself at your preferred $\alpha$.
edit I ran this experiment again, using many more replicates ($2^{18}$) per sample size. Here's a table of the empirical values of $l$. The first row is a NaN, then the alpha (type I rate). Following that, the first column is the size of the samples, $n$, then the empirical values of $l$. (I would expect that as $n \to \infty$ we would have $l \to 599 \alpha /2$)
NaN,0.001,0.005,0.01,0.025,0.05,0.1,0.15,0.2,0.25,0.333
16,0,0,1,4,9,22,35,49,64,88
23,0,0,1,4,10,23,37,51,66,91
32,0,0,1,4,10,24,38,52,67,92
45,0,0,1,5,11,25,39,54,69,94
64,0,0,2,5,12,26,41,55,70,95
91,0,1,2,6,13,27,42,56,71,96
128,0,1,2,6,13,28,42,58,72,97
181,0,1,2,6,13,28,43,58,73,98
256,0,1,2,6,14,28,43,58,73,98
362,0,1,2,7,14,29,44,59,74,99
512,0,1,2,7,14,29,44,59,74,99

