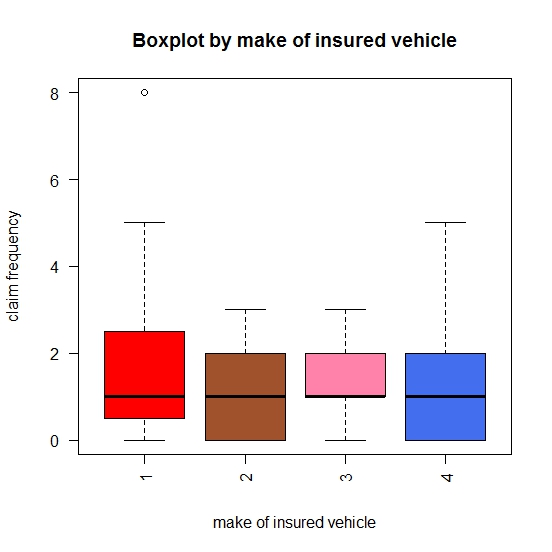
I have done a boxplot to represent my claim frequency. However make 2 and 4 have only 1 whisker. How do I interpret that?
First, it looks like Claim Frequency is a count with a relatively small range. A box plot may not be the best graphic. A mosaic plot might be better, or a table might also be better.
Second, given that you do have a box plot, having no lower whisker simply means that the bottom of the box is in the same place the whisker would be. The bottom of the box is something like the lower quartile (exactly what it is depends on the program; hinges and quartiles and different definitions of quartiles). So, for make 2 and 4, 25% of the cars had no claims.
This is the same reason that there are sometimes outliers and sometimes not.