2
$\begingroup$

I would like to report precision and recall for an existing binary classifier, which is a black box and which I cannot modify. I have a 1,000 test examples, sampled from a population of 100,000, and cannot obtain more. The confusion matrix looks as follows:

            prediction
            true   false
label true     7       3
label false    0     990

Based on this, the precision is 7 / (7+0) = 1.0 and the recall is 7 / (7+3) = 0.7. However, given small number of positives in the test set, my confidence in those metrics, and in precision in particular, is low. What techniques can I use to quantify this confidence?

Intuitively, if I had not 7 but 700 true positives and still zero false positives then my confidence in the precision being close to 1.0 would be higher; if this intuition is correct, how can I translate it to numbers?

Note:

  • The classifier only outputs a class prediction, not a probability.
  • At this point I assume that I have to report precision and recall and cannot use alternative metrics that might be more approriate in the presence of such class imbalance.
  • While I appreciate alternative suggestions, I am particularly interested in the answer to the question in bold.
$\endgroup$

3 Answers 3

2
$\begingroup$

You are correct to question the utility of such metrics given your sample size and the relative ration of the two classes. I think will be much more relevant to focus on making "probabilistic predictions" where the predictions refer at the probability of instance $i$ being a member of particular class $A$. In that case, a suitable metric would be the Brier Score, this would effectively be the RMSE of the probabilistic predictions.

I notice that you note that you "have to report precision and recall". I would suggest you rethink that constraint, it seems unreasonable. If you are definitely tied to those metrics I would suggest you use stratified bootstrap and present the estimates for the distribution of the bootstrapped metrics - probably in a histogram-like manner as there can only have 10 distinct values anyway. It will probably be the best alternative in showing how varying your precision and recall estimates are but let me stress that this an absolutely last resort approach given you cannot anything more reasonable (like at least an AUC-ROC?)

$\endgroup$
4
  • $\begingroup$ Thank you for taking the time to respond. I have now clarified that the classifier does not output probabilities, so I do not think I can use the metrics you suggested. I did try bootstrapping, and it allowed me to show that the variance on the recall is relatively wide; however, that does not help with precision, since there are no false positives at all in the test set, so during bootstrapping the precision always comes out as 1.0. $\endgroup$
    – narthi
    Commented Jul 29, 2018 at 13:56
  • $\begingroup$ I am glad I could help! :) Try to stratify the sample such that the percentage of positive in both training and validation sets are similar. That said, yes, if the FPs are always zero, we have to question whether the sample at hand is representative of the whole population and whether zero FP rate is something realistic. Here is where metric like Brier Score are especially relevant. I would also check what are the most important features these classifiers use, maybe there is some data-leakage in the dataset and we accidentally exploit it. $\endgroup$
    – usεr11852
    Commented Jul 29, 2018 at 14:23
  • $\begingroup$ Side-comment: Most classifiers output probabilities that are then turned into labels according to some cut-off. They are a few classifiers that do "hard class assignment" (e.g. SVMs) but even then there are some techniques to get probabilities (e.g. Isotonic Regression). Classifiers like: (Penalised) Logistic Regression, Random Forests, Gradient Boosting Machines, Discriminant Analysis, etc. can naturally return probabilistic class assignments. What classifier do you use? $\endgroup$
    – usεr11852
    Commented Jul 29, 2018 at 14:26
  • $\begingroup$ The classifier is an ensemble that includes logistic regression, but also a number of hand-designed rules that consider presence/absence of certain features in the input. $\endgroup$
    – narthi
    Commented Jul 30, 2018 at 10:07
2
$\begingroup$

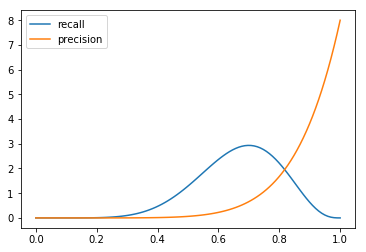
According to the paper by Goutte and Gaussier, $precision|\left<TP,FP\right>\sim Beta(TP+\lambda, FP+\lambda)$ and $recall|\left<TP,FN\right>\sim Beta(TP+\lambda, FN+\lambda)$, where $\lambda$ is an adjustment for prior. For the confusion table in question, and assuming uniform priors ($Beta(1,1)$) for both precision and recall, the distributions can be visualised with Python, scipy and pyplot:

import matplotlib.pyplot as plt
import numpy as np
from scipy.stats import beta

TP = 7
FN = 3
FP = 0

x = np.linspace(0, 1.0, 100)
plt.plot(x, beta.pdf(x, TP+1, FN+1), label="recall")
plt.plot(x, beta.pdf(x, TP+1, FP+1), label="precision")
plt.legend()

probability distributions for precision and recall

The 95% confidence intervals for precision and recall can be calculated as

(beta.ppf(0.025, TP+1, FP+1), beta.ppf(0.975, TP+1, FP+1)) # precision
(beta.ppf(0.025, TP+1, FN+1), beta.ppf(0.975, TP+1, FN+1)) # recall

resulting in:

  • precision: (0.6306, 0.9968)
  • recall: (0.3903, 0.8907)
$\endgroup$
1
  • $\begingroup$ Any details as to how this approach compares to the stratified bootstrap in terms of coverage / bias? $\endgroup$
    – Eike P.
    Commented Nov 14 at 22:58
1
$\begingroup$

One straightforward method you can consider is to try to estimate the probability of the error classes using a Bayesian approach. The beta distribution is the conjugate prior of the binomial distribution, so you could fit a beta distribution to your true/false positives to get an estimate of the confidence. I think that's essentially what's going on in this paper:

https://pdfs.semanticscholar.org/e399/9a46cb8aaf71131a77670da5c5c113aad01d.pdf

$\endgroup$
1
  • $\begingroup$ Thank you very much, the paper has exactly the answer I was looking for! I felt this answer would benefit from an example of how to apply the technique to the data in question, and my edit of your answer to that effect was rejected, so I posted it as a separate answer. $\endgroup$
    – narthi
    Commented Aug 6, 2018 at 12:29

Your Answer

By clicking “Post Your Answer”, you agree to our terms of service and acknowledge you have read our privacy policy.

Not the answer you're looking for? Browse other questions tagged or ask your own question.