Notice removed Authoritative reference needed by Adam Robinsson
Bounty Ended with Clark Chong's answer chosen by Adam Robinsson
added 27 characters in body
Source Link
Adam Robinsson
  • 2.4k
  • 3
  • 25
  • 40

I'm interested in a continuous variable, namely blood pressure.

The higher the blood pressure, the greater the risk of heart attack and stroke. However, observational datastudies frequently report that also low blood pressure is associated adverse outcomes.

The question is: what is the optimal blood pressure? At what value of blood pressure does risk start to increase?

In other words, how can I model, and visualize graphically, what hazard ratio various levels of blood pressure is associated with. I suspect that many of yousome will suggest restricted cubic splines. Do you have any suggestions on suitable R packages? that will help me visualize the effect of blood pressure on hazard. I'm fairly familiar with Cox regression and plan using it (viathe RMS package, with time. Time-dependent covariates) to model the predictorsvariables are included.

Sample data (no time-dependent variables):

event <- c(1,0,1,0,0,0,0,1,0,0,0,1,1,0,1,0,0,1,0,1,1,1,1,0,1,1,1,0,0,1)
survival <- c(4,29,24,29,29,29,29,19,29,29,29,3,9,29,15,29,29,11,29,5,13,20,22,29,16,21,9,29,29,15)
statin <- c(0,0,0,0,1,1,1,0,0,0,0,0,0,0,0,0,0,1,0,0,1,0,0,0,0,0,0,0,0,0)
bloodpressure <- c(160,120,150,140,135,110,139,140,153,129,149,163,179,129,144,119,100,115,145,150,130,120,122,129,116,171,129,126,159,150)
data <- data.frame(event, survival, statin, bloodpressure)
View(data)

require(rms)
fit <- coxph(Surv(survival, event) ~ statin + rcs(bloodpressure, 3), data=data)

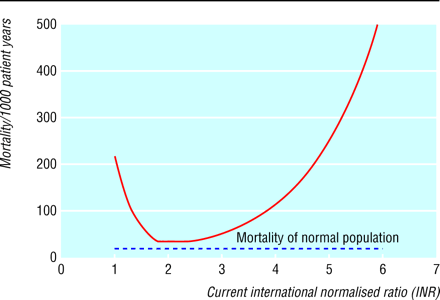
I had something like this in mind: http://www.bmj.com/content/325/7372/1073/F1 Via Poisson regression
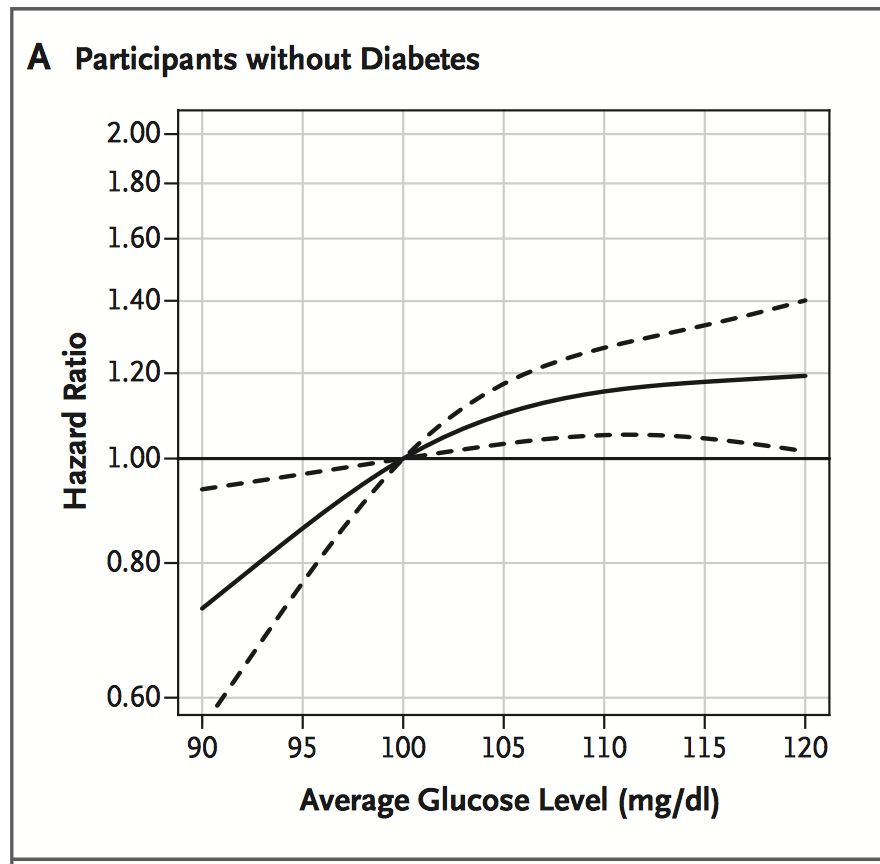
http://www.nejm.org/doi/full/10.1056/NEJMoa1215740 Via Cox regression
Thanks

I'm interested in a continuous variable, namely blood pressure.

The higher the blood pressure, the greater the risk of heart attack and stroke. However, observational data frequently report that also low blood pressure is associated adverse outcomes.

The question is: what is the optimal blood pressure? At what value of blood pressure does risk start to increase?

In other words, how can I model, and visualize graphically, what hazard ratio various levels of blood pressure is associated with. I suspect that many of you will suggest restricted cubic splines. Do you have any suggestions on suitable R packages? I'm fairly familiar with Cox regression and plan using it (via RMS package, with time-dependent covariates) to model the predictors.

Sample data (no time-dependent variables):

event <- c(1,0,1,0,0,0,0,1,0,0,0,1,1,0,1,0,0,1,0,1,1,1,1,0,1,1,1,0,0,1)
survival <- c(4,29,24,29,29,29,29,19,29,29,29,3,9,29,15,29,29,11,29,5,13,20,22,29,16,21,9,29,29,15)
statin <- c(0,0,0,0,1,1,1,0,0,0,0,0,0,0,0,0,0,1,0,0,1,0,0,0,0,0,0,0,0,0)
bloodpressure <- c(160,120,150,140,135,110,139,140,153,129,149,163,179,129,144,119,100,115,145,150,130,120,122,129,116,171,129,126,159,150)
data <- data.frame(event, survival, statin, bloodpressure)
View(data)

require(rms)
fit <- coxph(Surv(survival, event) ~ statin + rcs(bloodpressure, 3), data=data)

I had something like this in mind: http://www.bmj.com/content/325/7372/1073/F1 Via Poisson regression

http://www.nejm.org/doi/full/10.1056/NEJMoa1215740 Via Cox regression

Thanks

I'm interested in a continuous variable, namely blood pressure.

The higher the blood pressure, the greater the risk of heart attack and stroke. However, studies frequently report that also low blood pressure is associated adverse outcomes.

The question is: what is the optimal blood pressure? At what value of blood pressure does risk start to increase?

In other words, how can I model, and visualize graphically, what hazard ratio various levels of blood pressure is associated with. I suspect that some will suggest restricted cubic splines. Do you have any suggestions on suitable R packages that will help me visualize the effect of blood pressure on hazard. I'm fairly familiar with Cox regression and plan using the RMS package. Time-dependent variables are included.

Sample data (no time-dependent variables):

event <- c(1,0,1,0,0,0,0,1,0,0,0,1,1,0,1,0,0,1,0,1,1,1,1,0,1,1,1,0,0,1)
survival <- c(4,29,24,29,29,29,29,19,29,29,29,3,9,29,15,29,29,11,29,5,13,20,22,29,16,21,9,29,29,15)
statin <- c(0,0,0,0,1,1,1,0,0,0,0,0,0,0,0,0,0,1,0,0,1,0,0,0,0,0,0,0,0,0)
bloodpressure <- c(160,120,150,140,135,110,139,140,153,129,149,163,179,129,144,119,100,115,145,150,130,120,122,129,116,171,129,126,159,150)
data <- data.frame(event, survival, statin, bloodpressure)
View(data)

require(rms)
fit <- coxph(Surv(survival, event) ~ statin + rcs(bloodpressure, 3), data=data)

I had something like this in mind: http://www.bmj.com/content/325/7372/1073/F1 Via Poisson regression

http://www.nejm.org/doi/full/10.1056/NEJMoa1215740 Via Cox regression

Thanks

added 62 characters in body
Source Link
Adam Robinsson
  • 2.4k
  • 3
  • 25
  • 40

I'm interested in a continuous variable, namely blood pressure.

The higher the blood pressure, the greater the risk of heart attack and stroke. However, observational data frequently report that also low blood pressure is associated adverse outcomes.

The question is: what is the optimal blood pressure? At what value of blood pressure does risk start to increase?

In other words, how can I model, and visualize graphically, what hazard ratio various levels of blood pressure is associated with. I suspect that many of you will suggest restricted cubic splines. Do you have any suggestions on suitable R packages? I'm fairly familiar with Cox regression and plan using it (via RMS package, with time-dependent covariates) to model the predictors.

Sample data (no time-dependent variables):

event <- c(1,0,1,0,0,0,0,1,0,0,0,1,1,0,1,0,0,1,0,1,1,1,1,0,1,1,1,0,0,1)
survival <- c(4,29,24,29,29,29,29,19,29,29,29,3,9,29,15,29,29,11,29,5,13,20,22,29,16,21,9,29,29,15)
statin <- c(0,0,0,0,1,1,1,0,0,0,0,0,0,0,0,0,0,1,0,0,1,0,0,0,0,0,0,0,0,0)
bloodpressure <- c(160,120,150,140,135,110,139,140,153,129,149,163,179,129,144,119,100,115,145,150,130,120,122,129,116,171,129,126,159,150)
data <- data.frame(event, survival, statin, bloodpressure)
View(data)

require(rms)
fit <- coxph(Surv(survival, event) ~ statin + rcs(bloodpressure, 3), data=data)

I had something like this in mind: http://www.bmj.com/content/325/7372/1073/F1 Via Poisson regression

http://www.nejm.org/doi/full/10.1056/NEJMoa1215740 Via Cox regression

Thanks

I'm interested in a continuous variable, namely blood pressure.

The higher the blood pressure, the greater the risk of heart attack and stroke. However, observational data frequently report that also low blood pressure is associated adverse outcomes.

The question is: what is the optimal blood pressure? At what value of blood pressure does risk start to increase?

In other words, how can I model, and visualize graphically, what hazard ratio various levels of blood pressure is associated with. I suspect that many of you will suggest restricted cubic splines. Do you have any suggestions on suitable R packages? I'm fairly familiar with Cox regression and plan using it (via RMS package) to model the predictors.

Sample data:

event <- c(1,0,1,0,0,0,0,1,0,0,0,1,1,0,1,0,0,1,0,1,1,1,1,0,1,1,1,0,0,1)
survival <- c(4,29,24,29,29,29,29,19,29,29,29,3,9,29,15,29,29,11,29,5,13,20,22,29,16,21,9,29,29,15)
statin <- c(0,0,0,0,1,1,1,0,0,0,0,0,0,0,0,0,0,1,0,0,1,0,0,0,0,0,0,0,0,0)
bloodpressure <- c(160,120,150,140,135,110,139,140,153,129,149,163,179,129,144,119,100,115,145,150,130,120,122,129,116,171,129,126,159,150)
data <- data.frame(event, survival, statin, bloodpressure)
View(data)

require(rms)
fit <- coxph(Surv(survival, event) ~ statin + rcs(bloodpressure, 3), data=data)

I had something like this in mind: http://www.bmj.com/content/325/7372/1073/F1 Via Poisson regression

http://www.nejm.org/doi/full/10.1056/NEJMoa1215740 Via Cox regression

Thanks

I'm interested in a continuous variable, namely blood pressure.

The higher the blood pressure, the greater the risk of heart attack and stroke. However, observational data frequently report that also low blood pressure is associated adverse outcomes.

The question is: what is the optimal blood pressure? At what value of blood pressure does risk start to increase?

In other words, how can I model, and visualize graphically, what hazard ratio various levels of blood pressure is associated with. I suspect that many of you will suggest restricted cubic splines. Do you have any suggestions on suitable R packages? I'm fairly familiar with Cox regression and plan using it (via RMS package, with time-dependent covariates) to model the predictors.

Sample data (no time-dependent variables):

event <- c(1,0,1,0,0,0,0,1,0,0,0,1,1,0,1,0,0,1,0,1,1,1,1,0,1,1,1,0,0,1)
survival <- c(4,29,24,29,29,29,29,19,29,29,29,3,9,29,15,29,29,11,29,5,13,20,22,29,16,21,9,29,29,15)
statin <- c(0,0,0,0,1,1,1,0,0,0,0,0,0,0,0,0,0,1,0,0,1,0,0,0,0,0,0,0,0,0)
bloodpressure <- c(160,120,150,140,135,110,139,140,153,129,149,163,179,129,144,119,100,115,145,150,130,120,122,129,116,171,129,126,159,150)
data <- data.frame(event, survival, statin, bloodpressure)
View(data)

require(rms)
fit <- coxph(Surv(survival, event) ~ statin + rcs(bloodpressure, 3), data=data)

I had something like this in mind: http://www.bmj.com/content/325/7372/1073/F1 Via Poisson regression

http://www.nejm.org/doi/full/10.1056/NEJMoa1215740 Via Cox regression

Thanks

Tweeted twitter.com/#!/StackStats/status/528914463471071233
Notice added Authoritative reference needed by Adam Robinsson
Bounty Started worth 50 reputation by Adam Robinsson
added sample data and example of expected output
Source Link
Adam Robinsson
  • 2.4k
  • 3
  • 25
  • 40

I'm interested in a continuous variable, namely blood pressure.

The higher the blood pressure, the greater the risk of heart attack and stroke. However, observational data frequently report that also low blood pressure is associated adverse outcomes.

The question is: what is the optimal blood pressure? At what value of blood pressure does risk start to increase?

In other words, how can I model, and visualize graphically, what hazard ratio various levels of blood pressure is associated with. I suspect that many of you will suggest restricted cubic splines. Do you have any suggestions on suitable R packages? I'm fairly familiar with Cox regression and plan using it (via RMS package) to model the predictors.

Sample data:

event <- c(1,0,1,0,0,0,0,1,0,0,0,1,1,0,1,0,0,1,0,1,1,1,1,0,1,1,1,0,0,1)
survival <- c(4,29,24,29,29,29,29,19,29,29,29,3,9,29,15,29,29,11,29,5,13,20,22,29,16,21,9,29,29,15)
statin <- c(0,0,0,0,1,1,1,0,0,0,0,0,0,0,0,0,0,1,0,0,1,0,0,0,0,0,0,0,0,0)
bloodpressure <- c(160,120,150,140,135,110,139,140,153,129,149,163,179,129,144,119,100,115,145,150,130,120,122,129,116,171,129,126,159,150)
data <- data.frame(event, survival, statin, bloodpressure)
View(data)

require(rms)
fit <- coxph(Surv(survival, event) ~ statin + rcs(bloodpressure, 3), data=data)

I had something like this in mind: http://www.bmj.com/content/325/7372/1073/F1 Via Poisson regression

http://www.nejm.org/doi/full/10.1056/NEJMoa1215740 Via Cox regression

Thanks

I'm interested in a continuous variable, namely blood pressure.

The higher the blood pressure, the greater the risk of heart attack and stroke. However, observational data frequently report that also low blood pressure is associated adverse outcomes.

The question is: what is the optimal blood pressure? At what value of blood pressure does risk start to increase?

In other words, how can I model, and visualize graphically, what hazard ratio various levels of blood pressure is associated with. I suspect that many of you will suggest restricted cubic splines. Do you have any suggestions on suitable R packages? I'm fairly familiar with Cox regression and plan using it (via RMS package) to model the predictors.

I had something like this in mind: Via Poisson regression

Via Cox regression

Thanks

I'm interested in a continuous variable, namely blood pressure.

The higher the blood pressure, the greater the risk of heart attack and stroke. However, observational data frequently report that also low blood pressure is associated adverse outcomes.

The question is: what is the optimal blood pressure? At what value of blood pressure does risk start to increase?

In other words, how can I model, and visualize graphically, what hazard ratio various levels of blood pressure is associated with. I suspect that many of you will suggest restricted cubic splines. Do you have any suggestions on suitable R packages? I'm fairly familiar with Cox regression and plan using it (via RMS package) to model the predictors.

Sample data:

event <- c(1,0,1,0,0,0,0,1,0,0,0,1,1,0,1,0,0,1,0,1,1,1,1,0,1,1,1,0,0,1)
survival <- c(4,29,24,29,29,29,29,19,29,29,29,3,9,29,15,29,29,11,29,5,13,20,22,29,16,21,9,29,29,15)
statin <- c(0,0,0,0,1,1,1,0,0,0,0,0,0,0,0,0,0,1,0,0,1,0,0,0,0,0,0,0,0,0)
bloodpressure <- c(160,120,150,140,135,110,139,140,153,129,149,163,179,129,144,119,100,115,145,150,130,120,122,129,116,171,129,126,159,150)
data <- data.frame(event, survival, statin, bloodpressure)
View(data)

require(rms)
fit <- coxph(Surv(survival, event) ~ statin + rcs(bloodpressure, 3), data=data)

I had something like this in mind: http://www.bmj.com/content/325/7372/1073/F1 Via Poisson regression

http://www.nejm.org/doi/full/10.1056/NEJMoa1215740 Via Cox regression

Thanks

added 75 characters in body
Source Link
Adam Robinsson
  • 2.4k
  • 3
  • 25
  • 40
Loading
added 114 characters in body
Source Link
Adam Robinsson
  • 2.4k
  • 3
  • 25
  • 40
Loading
Source Link
Adam Robinsson
  • 2.4k
  • 3
  • 25
  • 40
Loading