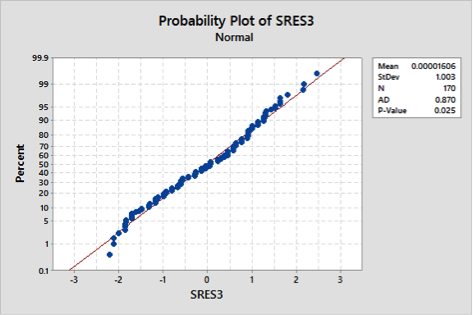
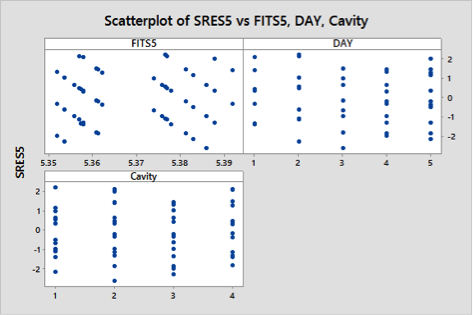
I'm experiencing strange patters about residuals. The following chart is a scatterplot of Standard residuals (Sres) versus Fits. I'm interested in the diagonal lines that means that an higher fits leads to a smaller error.


General Factorial Regression: Y versus Cavity, DAY

Method

Rows unused  10


Factor Information

Factor  Levels  Values
Cavity       4  1, 2, 3, 4
DAY          5  1, 2, 3, 4, 5


Analysis of Variance

Source                 DF    Adj SS    Adj MS  F-Value  P-Value
Model                  19  0.025927  0.001365    33.07    0.000
  Linear                7  0.024252  0.003465    83.97    0.000
    Cavity              3  0.022556  0.007519   182.24    0.000
    DAY                 4  0.001336  0.000334     8.10    0.000
  2-Way Interactions   12  0.000733  0.000061     1.48    0.137
    Cavity*DAY         12  0.000733  0.000061     1.48    0.137
Error                 150  0.006189  0.000041
Total                 169  0.032115


Model Summary

        S    R-sq  R-sq(adj)  R-sq(pred)
0.0064232  80.73%     78.29%      75.29%


Fits and Diagnostics for Unusual Observations

Obs  Y_1_1_1      Fit     Resid  Std Resid
  8  5.37000  5.35800   0.01200       2.09  R
 27  5.34000  5.35375  -0.01375      -2.29  R
 41  5.39000  5.37667   0.01333       2.20  R
 48  5.37000  5.35700   0.01300       2.13  R
 54  5.39000  5.37700   0.01300       2.13  R
 82  5.37000  5.38600  -0.01600      -2.63  R
142  5.40000  5.38778   0.01222       2.02  R
161  5.37000  5.38300  -0.01300      -2.13  R

R  Large residual
Is there a common reason for this behaviour?
The response variabile is a diameter of the inner circle fit of a plastic component made by injection. The factors of the ANOVA are the Day of the production and the Cavity since there are 4 cavity in the mould.


