First off, you should check the nature of your outliers. Are they within the natural range of your variable?
E.g. you have measured weight for 100 people. Most would be between 50kg - 120kg. If you then have an outlier at say 200kg, ask yourself, is this possible? Yes, it could be a very heavy person.
However, if you have a value that is 1000kg, you would think "This is absolutely impossible". Maybe someone added a "0" too many. This could be administrational error and should be fixed or removed from the dataset.
If you have outliers that are within the possible range of the variable, you can still run a linear regression analysis. However, certain outliers can skew the data and hence skew your analysis. Lets say you're modeling weight vs. blood pressure. You'd expect individuals with low weight to have low blood pressure, and individuals with a heavy weight to have a high blood pressure. If an outlier has a low blood pressure and a heavy weight, it can skew your analysis.
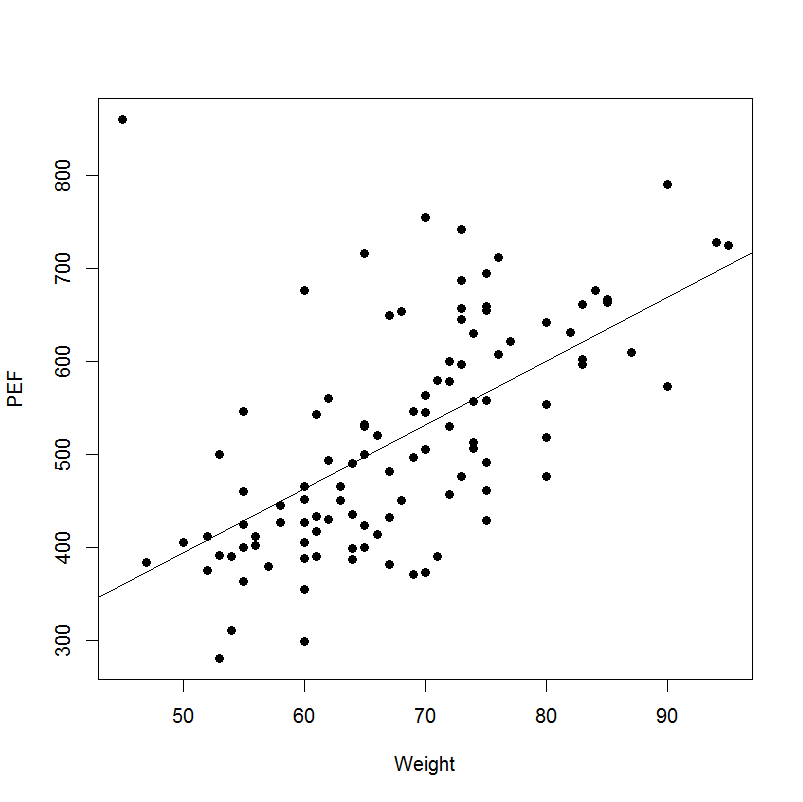
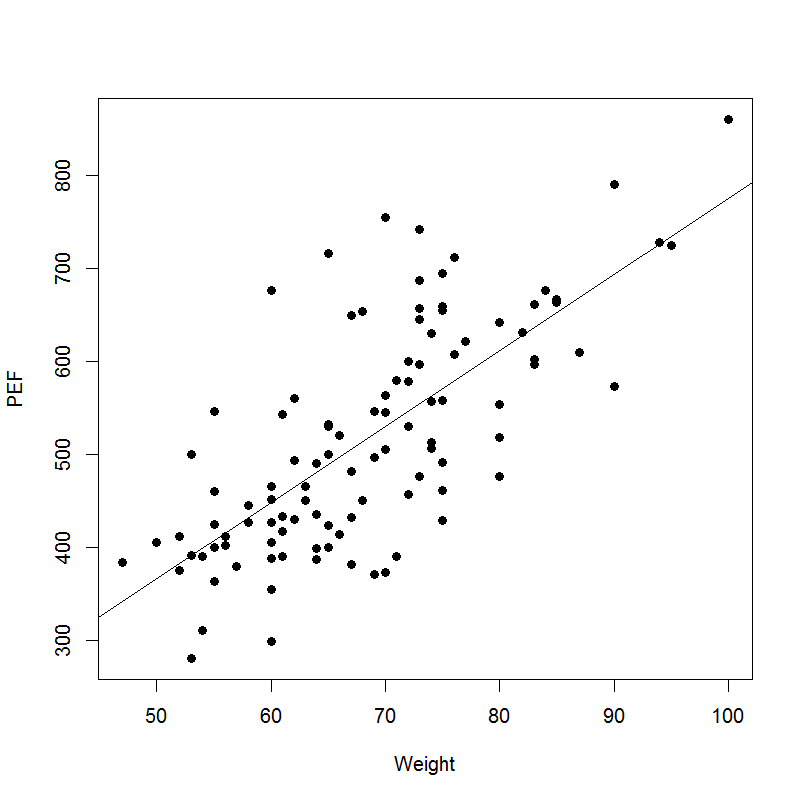
To illustrate, here is an example with weight vs. PEF (A value for breathing/lung strength)
Compare the outlier and the regression line in:
With the one in:
In the second image, the regression line appears to show a stronger linear relationship between weight and PEF. The outlier in the first image has a low weight and high PEF, skewing the data. The amount of influence an outlier has on the outcome can be measured. Two methods are Cook's distance and DfBeta. Values that can be problematic have a
Cook's distance > 4/n
or
DfBeta > 2 / square root(n)


