I have a very general statistical question. If a variable has some extreme values, then for the purpose of statistical inferences for example OLS regression, is it better to detect these extreme values and remove them from the data. And if yes, then what is the statistical explanation?
-
1$\begingroup$ It might not be a good idea to remove such data. Use a loss function which is robust to outliers, e.g. Hinge loss. The squared loss is shown to be quite sensitive to outliers. $\endgroup$– Vladislavs DovgalecsCommented Feb 9, 2016 at 17:29
3 Answers
A key distinction: mismeasurement or extreme events?
Are extreme values due to extreme events or error? You generally want to include the former but exclude the latter. You don't want your results driven by error. More generally, you don't want results driven by bizarre, weird behavior that's not related to what you're trying to model.
Some examples:
- In finance, excluding extreme events like bankruptcy would be a horrible mistake. It is often the extreme observations (eg. deaths, -100% returns, crashes) that you really care about!
- On the other hand, financial data isn't perfect. You can find cases where decimal points are in the wrong place, 100.00 is mistakenly recorded as 10000 etc...
- There's often fuzzy stuff in between...
A key distinction: left hand side or right hand side variables?
Dropping observations conditional on the value of a left hand side variable tends to be problematic. It can easily qualify as research misconduct, like trying to estimate the effects of schooling and dropping all the low test scores under some dubious argument that they somehow don't count.
Depending on context, transforming right hand side variables can be OK. There's often more flexibility on what you're using to try to predict or explain the data.
Some techniques that can be valid (depending on context):
For example in accounting data, you often have a few companies with bizarre, extreme numbers and you want to give ordinary least squares regression a reasonable shot at fitting something other than the few outliers. To reduce the effect of outliers, you can:
- Trim the data (eg. drop 1 percent most extreme observations). This is most reasonable if the outliers are almost certainly entirely wrong. (eg. an entry for a human's height of -2 feet or 135 feet). You can go seriously wrong by trimming the data though.
- Arguably better is to winsorize the data: eg. replace values above the 99th percentile with value of the 99th percentile.
- More complicated outlier detection systems such as ellipsodial peeling: find the minimum volume ellipse that encloses the data and then drop points on the boundary.
Robust methods:
There are other types of regression that may be more robust to extreme outliers.
- Quantile regression (eg. fit the median)
- Instead of minimizing sum of squares, use the Huber loss function or something with less penalty for big outliers.
There are a lot of different approaches people use to deal with outliers, and what's reasonable often depends on context.
-
$\begingroup$ Thank you for the help and remedies that you have provided for dealing with outliers and extreme values. It is very helpful indeed! $\endgroup$ Commented Feb 11, 2016 at 13:04
First off, you should check the nature of your outliers. Are they within the natural range of your variable?
E.g. you have measured weight for 100 people. Most would be between 50kg - 120kg. If you then have an outlier at say 200kg, ask yourself, is this possible? Yes, it could be a very heavy person.
However, if you have a value that is 1000kg, you would think "This is absolutely impossible". Maybe someone added a "0" too many. This could be administrational error and should be fixed or removed from the dataset.
If you have outliers that are within the possible range of the variable, you can still run a linear regression analysis. However, certain outliers can skew the data and hence skew your analysis. Lets say you're modeling weight vs. blood pressure. You'd expect individuals with low weight to have low blood pressure, and individuals with a heavy weight to have a high blood pressure. If an outlier has a low blood pressure and a heavy weight, it can skew your analysis.
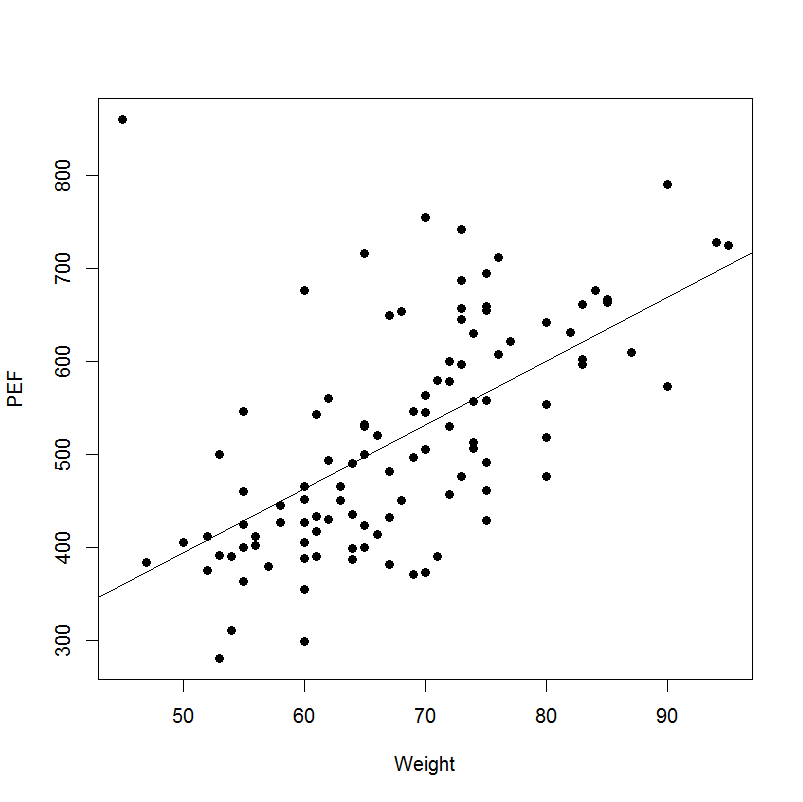
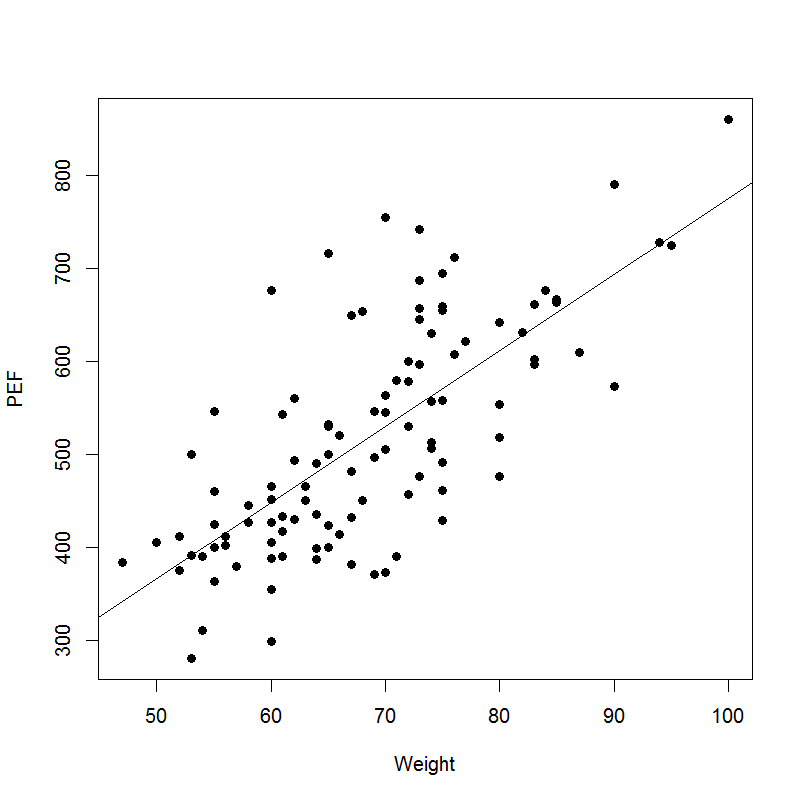
To illustrate, here is an example with weight vs. PEF (A value for breathing/lung strength)
Compare the outlier and the regression line in:
With the one in:
In the second image, the regression line appears to show a stronger linear relationship between weight and PEF. The outlier in the first image has a low weight and high PEF, skewing the data. The amount of influence an outlier has on the outcome can be measured. Two methods are Cook's distance and DfBeta. Values that can be problematic have a
Cook's distance > 4/n
or
DfBeta > 2 / square root(n)
-
$\begingroup$ Thank you very much for your help! It is very insightful. $\endgroup$ Commented Feb 11, 2016 at 13:02
Typically, it is better to remove this values, called outliers. But I would warn you not to use OLS regression in order to detect such outliers: you will probably construct the wrong model and the outliers will be probably wrong. Instead of it, use robust linear regression model and calculate standardized residuals for it (using robust estimator of standard deviation), and then remove everything that you can not expect by chance (so tune your threshold according to the sample size).
The explanation of outliers is that your data does not follow your theoretical assumptions. There can be several possible reasons: your theoretical assumptions are wrong or you have data points generated by random variable with other distribution (so you have mixture of two or more distributions with some proportion, typically, we call outliers everything that belong to the smallest proportion, so less than 50% of data are outliers). It can not be "diagnosed by photo", without full understanding of what are you trying to do.


