Bumped by Community user
updated per comment
Source Link
EngrStudent
  • 9.9k
  • 2
  • 37
  • 93

Is there a proper or ideal way to annotate a bubble chart outside of what is required for a standard 2-variale scatterplot?

The bubble area is supposed to be associated with the 3rd variable, but is there something that should say so? Is there a way to properly indicate what the third variable is?

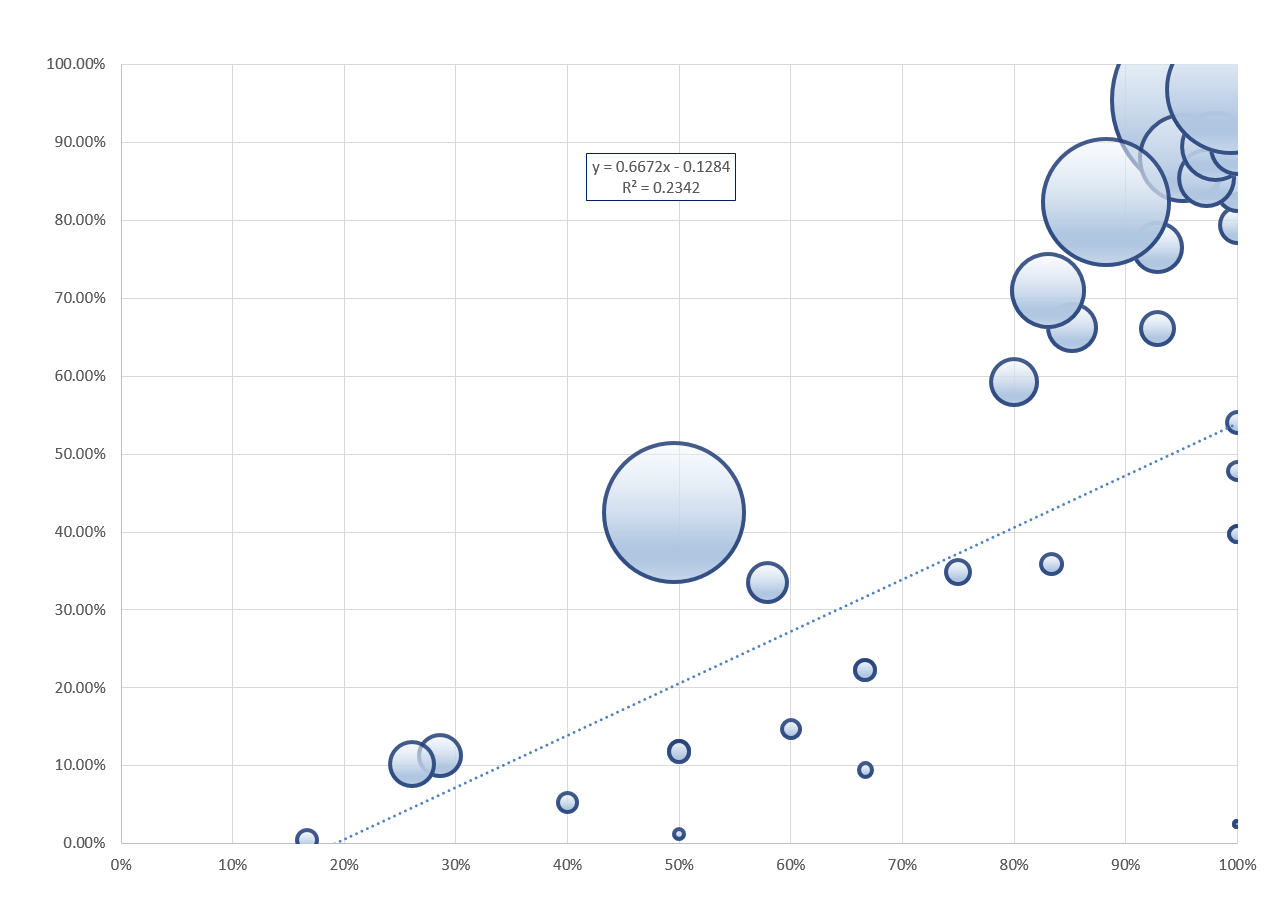
So here is my scatterplot, except that bubbles replace the points, and the bubble area is related to a third variable, not x or y.

enter image description here

How do I say what the bubble sizes are? Is there something that I need to say about the fit line being not weighted? Should I have a x=y line?

I know that I will need title, axis labels, and to clean up units on the y-axis. Is there anything else needed?

Is there a proper or ideal way to annotate a bubble chart outside of what is required for a standard 2-variale scatterplot?

The bubble area is supposed to be associated with the 3rd variable, but is there something that should say so? Is there a way to properly indicate what the third variable is?

Is there a proper or ideal way to annotate a bubble chart outside of what is required for a standard 2-variale scatterplot?

The bubble area is supposed to be associated with the 3rd variable, but is there something that should say so? Is there a way to properly indicate what the third variable is?

So here is my scatterplot, except that bubbles replace the points, and the bubble area is related to a third variable, not x or y.

enter image description here

How do I say what the bubble sizes are? Is there something that I need to say about the fit line being not weighted? Should I have a x=y line?

I know that I will need title, axis labels, and to clean up units on the y-axis. Is there anything else needed?

Source Link
EngrStudent
  • 9.9k
  • 2
  • 37
  • 93

annotate a bubble chart

Is there a proper or ideal way to annotate a bubble chart outside of what is required for a standard 2-variale scatterplot?

The bubble area is supposed to be associated with the 3rd variable, but is there something that should say so? Is there a way to properly indicate what the third variable is?