added 251 characters in body
Source Link
IrishStat
  • 30k
  • 5
  • 36
  • 60

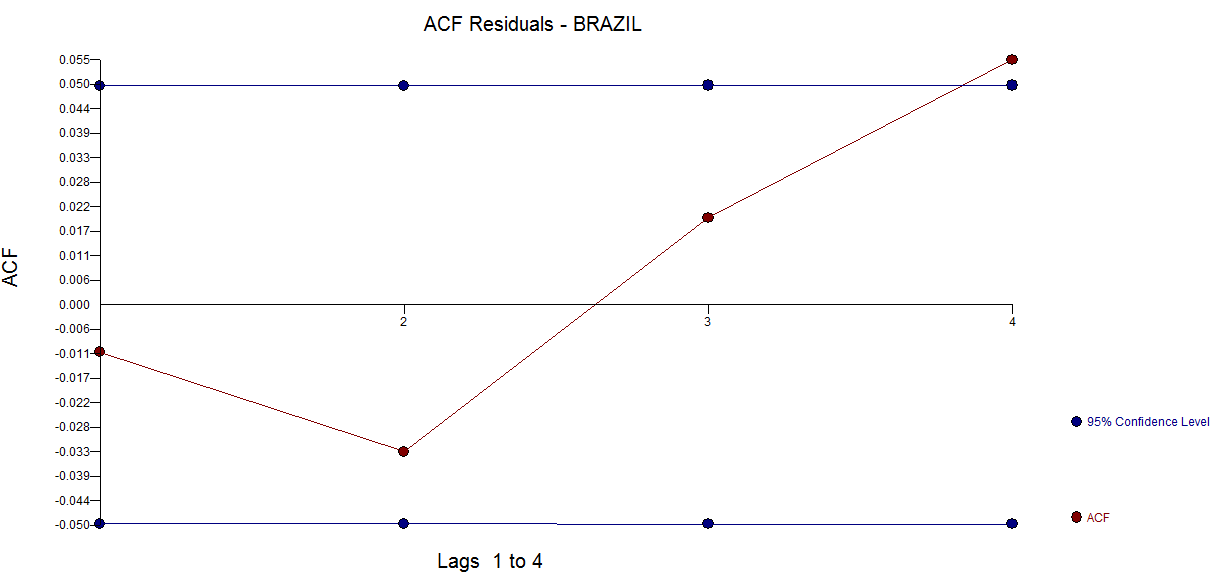
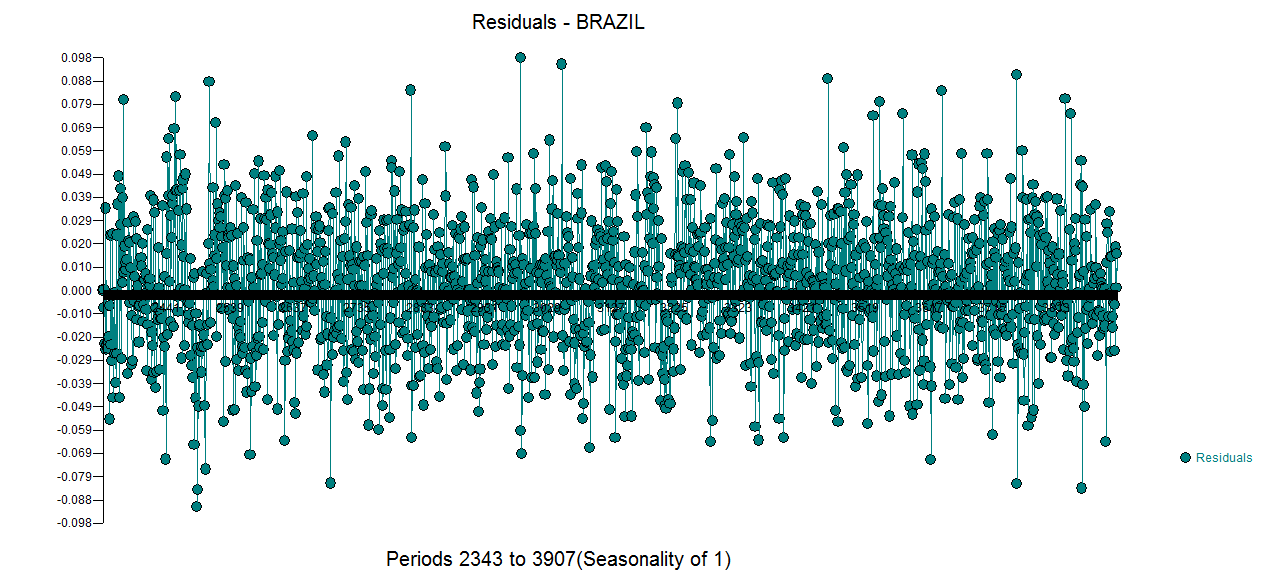
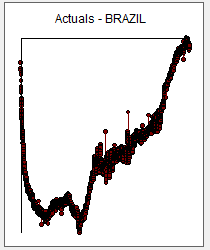
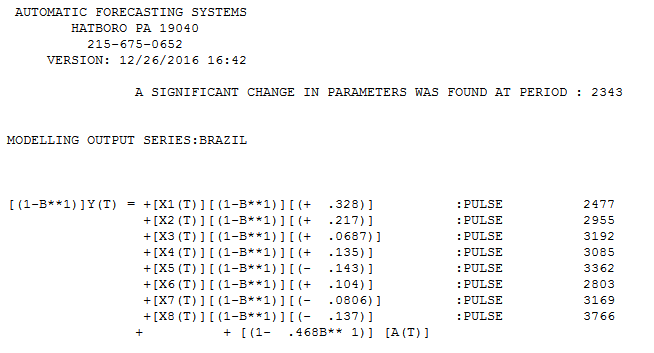
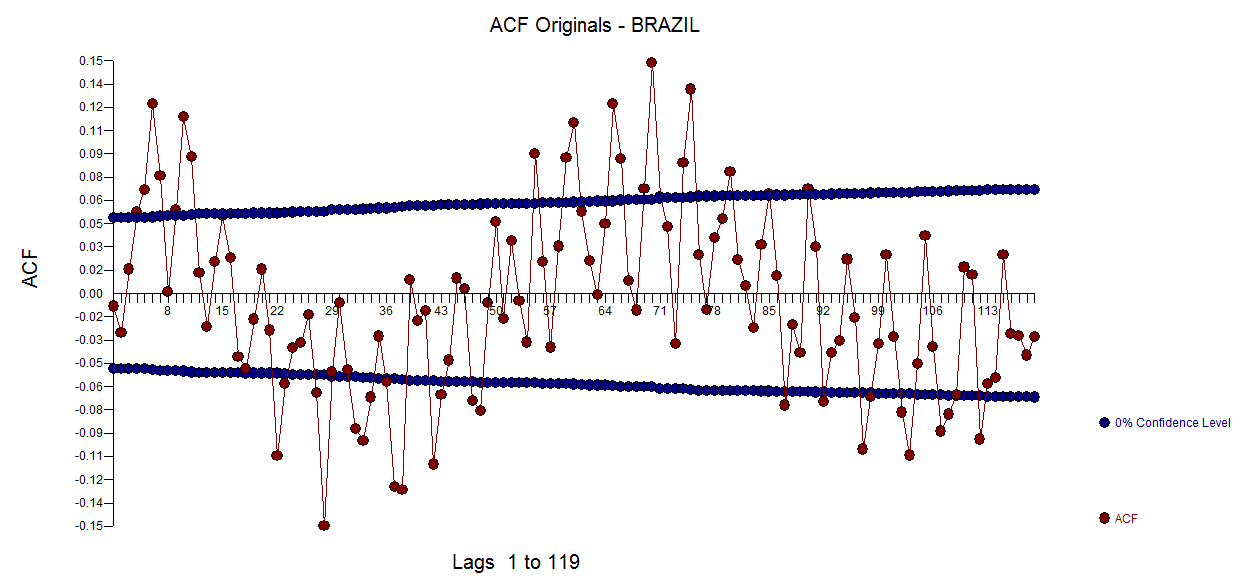
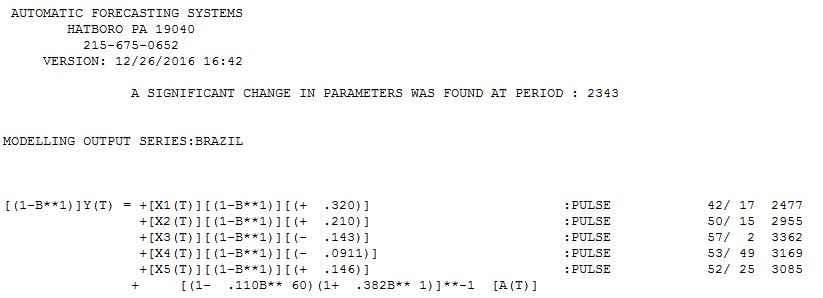
You originally had 500,000 readings, 128 per second for 3,907 seconds. After taking the readings at 1 second interval (N=3907) the plot is here enter image description here . AUTOBOX identified a break point in parameters at period 2343 +/- 300 time points. Taking the most recent 1565 values this is then the identified model enter image description here (1,1,0) with an ACF of the residuals here suggesting model insufficiency enter image description here. It appears that there is significant auto-projective structure at period 60 suggesting an hourly effect .There were a few (8) anomalous data points ( also visually obvious) which were identified and rectified/adjusted . Some sort of SARIMA might be necessary of the form (1,1,0)(1,0,0)60 . I will sharpen my pencil and try to resolve this as ARIMA modelling is an ITERATIVE PROCESS.
AFTER ADDING A 60 PERIOD COEFFICIENT :

enter image description here

this captures the short-term (second) and the long-term (hourly) structure

You originally had 500,000 readings, 128 per second for 3,907 seconds. After taking the readings at 1 second interval (N=3907) the plot is here enter image description here . AUTOBOX identified a break point in parameters at period 2343 +/- 300 time points. Taking the most recent 1565 values this is then the identified model enter image description here (1,1,0) with an ACF of the residuals here suggesting model insufficiency enter image description here. It appears that there is significant auto-projective structure at period 60 suggesting an hourly effect .There were a few (8) anomalous data points ( also visually obvious) which were identified and rectified/adjusted . Some sort of SARIMA might be necessary of the form (1,1,0)(1,0,0)60 . I will sharpen my pencil and try to resolve this.

You originally had 500,000 readings, 128 per second for 3,907 seconds. After taking the readings at 1 second interval (N=3907) the plot is here enter image description here . AUTOBOX identified a break point in parameters at period 2343 +/- 300 time points. Taking the most recent 1565 values this is then the identified model enter image description here (1,1,0) with an ACF of the residuals here suggesting model insufficiency enter image description here. It appears that there is significant auto-projective structure at period 60 suggesting an hourly effect .There were a few (8) anomalous data points ( also visually obvious) which were identified and rectified/adjusted . Some sort of SARIMA might be necessary of the form (1,1,0)(1,0,0)60 . I will sharpen my pencil and try to resolve this as ARIMA modelling is an ITERATIVE PROCESS.

AFTER ADDING A 60 PERIOD COEFFICIENT :

enter image description here

this captures the short-term (second) and the long-term (hourly) structure
deleted 37 characters in body
Source Link
IrishStat
  • 30k
  • 5
  • 36
  • 60

You originally had 500,000 readings, 128 per second for 3,907 seconds. After taking the readings at 1 second interval (N=3907) the plot is here enter image description here . AUTOBOX identified a break point in parameters at period 2343 +/- 300 time points. Taking the most recent 1565 values this is then the identified model enter image description here (1,1,0) with an ACF of the residuals here enter image description here and a plot of the residuals here suggesting model sufficiencyinsufficiency enter image description hereenter image description here. ThereIt appears that there is significant auto-projective structure at period 60 suggesting an hourly effect .There were a few (8) anomalous data points ( also visually obvious) which were identified and rectified/adjusted . Some sort of SARIMA might be necessary of the form (1,1,0)(1,0,0)60 . I will sharpen my pencil and try to resolve this.

You originally had 500,000 readings, 128 per second for 3,907 seconds. After taking the readings at 1 second interval (N=3907) the plot is here enter image description here . AUTOBOX identified a break point in parameters at period 2343 +/- 300 time points. Taking the most recent 1565 values this is then the identified model enter image description here (1,1,0) with an ACF of the residuals here enter image description here and a plot of the residuals here suggesting model sufficiency enter image description here. There were a few (8) anomalous data points ( also visually obvious) which were identified and rectified/adjusted .

You originally had 500,000 readings, 128 per second for 3,907 seconds. After taking the readings at 1 second interval (N=3907) the plot is here enter image description here . AUTOBOX identified a break point in parameters at period 2343 +/- 300 time points. Taking the most recent 1565 values this is then the identified model enter image description here (1,1,0) with an ACF of the residuals here suggesting model insufficiency enter image description here. It appears that there is significant auto-projective structure at period 60 suggesting an hourly effect .There were a few (8) anomalous data points ( also visually obvious) which were identified and rectified/adjusted . Some sort of SARIMA might be necessary of the form (1,1,0)(1,0,0)60 . I will sharpen my pencil and try to resolve this.

Source Link
IrishStat
  • 30k
  • 5
  • 36
  • 60

You originally had 500,000 readings, 128 per second for 3,907 seconds. After taking the readings at 1 second interval (N=3907) the plot is here enter image description here . AUTOBOX identified a break point in parameters at period 2343 +/- 300 time points. Taking the most recent 1565 values this is then the identified model enter image description here (1,1,0) with an ACF of the residuals here enter image description here and a plot of the residuals here suggesting model sufficiency enter image description here. There were a few (8) anomalous data points ( also visually obvious) which were identified and rectified/adjusted .