added 419 characters in body
Source Link
Nick
  • 856
  • 7
  • 25

A dependence measure is a parameter of a Gauss copula. Let denote by $\rho$ the Pearson correlation, $\rho_s$ the Spearman correlation, and $\tau_k$ the Kendell tau.

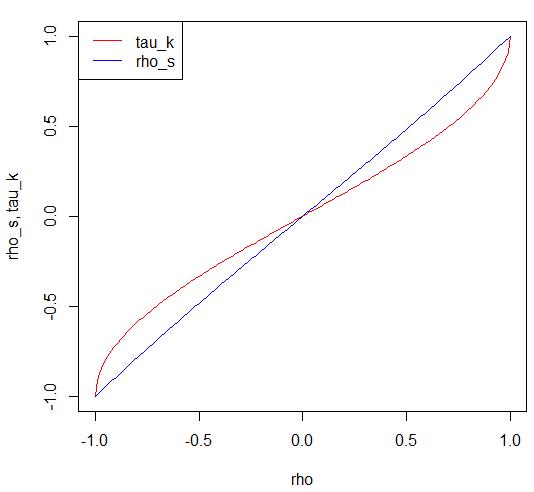
It's known $\rho \in [-1,1]$, and $$\rho_s = \frac{6}{\pi}\cdot arcsin(\frac{\rho}{2}) ,$$ $$\tau_k = \frac{2}{\pi}\cdot arcsin(\rho).$$

In the plot below one can see the dependencies between $\rho_s$, $\tau_k$ and $\rho$.

enter image description here

    rho <- seq(-1,1,0.01)     # Pearson correlation
    rho_s <- 6/pi*asin(rho/2) # Spearman correlation
    tau_k <- 2/pi*asin(rho)   # Kendell tau
    plot(rho, rho, type="n", xlab="rho", ylab="rho_s, tau_k")
    lines(rho, tau_k, col = "red")
    lines(rho, rho_s, col = "blue")
    legend("topleft", lty=c(1,1), col = c("red", "blue"), legend=c("tau_k", "rho_s"))

enter image description here

rho <- seq(-1,1,0.01)     # Pearson correlation
    rho_s <- 6/pi*asin(rho/2) # Spearman correlation
    tau_k <- 2/pi*asin(rho)   # Kendell tau
    plot(rho, rho, type="n", xlab="rho", ylab="rho_s, tau_k")
    lines(rho, tau_k, col = "red")
    lines(rho, rho_s, col = "blue")
    legend("topleft", lty=c(1,1), col = c("red", "blue"), legend=c("tau_k", "rho_s"))
A dependence measure is a parameter of a Gauss copula. Let denote by $\rho$ the Pearson correlation, $\rho_s$ the Spearman correlation, and $\tau_k$ the Kendell tau.

It's known $\rho \in [-1,1]$, and $$\rho_s = \frac{6}{\pi}\cdot arcsin(\frac{\rho}{2}) ,$$ $$\tau_k = \frac{2}{\pi}\cdot arcsin(\rho).$$

In the plot below one can see the dependencies between $\rho_s$, $\tau_k$ and $\rho$.

enter image description here

    rho <- seq(-1,1,0.01)     # Pearson correlation
    rho_s <- 6/pi*asin(rho/2) # Spearman correlation
    tau_k <- 2/pi*asin(rho)   # Kendell tau
    plot(rho, rho, type="n", xlab="rho", ylab="rho_s, tau_k")
    lines(rho, tau_k, col = "red")
    lines(rho, rho_s, col = "blue")
    legend("topleft", lty=c(1,1), col = c("red", "blue"), legend=c("tau_k", "rho_s"))
Source Link
Nick
  • 856
  • 7
  • 25

enter image description here

rho <- seq(-1,1,0.01)     # Pearson correlation
    rho_s <- 6/pi*asin(rho/2) # Spearman correlation
    tau_k <- 2/pi*asin(rho)   # Kendell tau
    plot(rho, rho, type="n", xlab="rho", ylab="rho_s, tau_k")
    lines(rho, tau_k, col = "red")
    lines(rho, rho_s, col = "blue")
    legend("topleft", lty=c(1,1), col = c("red", "blue"), legend=c("tau_k", "rho_s"))