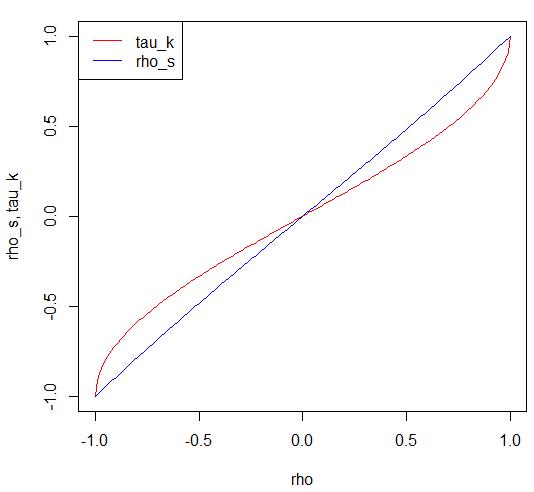
rho <- seq(-1,1,0.01)     # Pearson correlation
    rho_s <- 6/pi*asin(rho/2) # Spearman correlation
    tau_k <- 2/pi*asin(rho)   # Kendell tau
    plot(rho, rho, type="n", xlab="rho", ylab="rho_s, tau_k")
    lines(rho, tau_k, col = "red")
    lines(rho, rho_s, col = "blue")
    legend("topleft", lty=c(1,1), col = c("red", "blue"), legend=c("tau_k", "rho_s"))
Nick
- 856
- 7
- 25

