added 18 characters in body
Source Link
Viral
  • 21
  • 5

I have Latitude ,longitude and timestamp of image. I want to cluster these image according to detect events. For instance I went to Paris for 4 days then london 3 days and so on. So I want to detect cluster of Paris data and after london.I want each event to be seperated. How can I use this Latitude ,longitude and timestamp together to make cluster? I have done with DBSCAN algorithm but could note merge the time in it.Look at mypopular Gboeing code if it helps to understand problem.

enter image description here

I have CSV file in my code which contain following thing ,lon,date,city,country 51.4812916,-0.4510112,05/14/2014 09:07,West Drayton,United Kingdom

I have Latitude ,longitude and timestamp of image. I want to cluster these image according to detect events. For instance I went to Paris for 4 days then london 3 days and so on. So I want to detect cluster of Paris data and after london.I want each event to be seperated. How can I use this Latitude ,longitude and timestamp together to make cluster? I have done with DBSCAN algorithm but could note merge the time in it.Look at my code if it helps to understand problem.

enter image description here

I have CSV file in my code which contain following thing ,lon,date,city,country 51.4812916,-0.4510112,05/14/2014 09:07,West Drayton,United Kingdom

I have Latitude ,longitude and timestamp of image. I want to cluster these image according to detect events. For instance I went to Paris for 4 days then london 3 days and so on. So I want to detect cluster of Paris data and after london.I want each event to be seperated. How can I use this Latitude ,longitude and timestamp together to make cluster? I have done with DBSCAN algorithm but could note merge the time in it.Look at popular Gboeing code if it helps to understand problem.

enter image description here

I have CSV file in my code which contain following thing ,lon,date,city,country 51.4812916,-0.4510112,05/14/2014 09:07,West Drayton,United Kingdom

Included my code
Source Link
Viral
  • 21
  • 5

import pandas as pd, numpy as np, matplotlib.pyplot as plt, time from sklearn.cluster import DBSCAN from sklearn import metrics from geopy.distance import great_circle from shapely.geometry import MultiPoint

define the number of kilometers in one radian

kms_per_radian = 6371.0088

load the data set

df = pd.read_csv('data/summer-travel-gps-full.csv', encoding='utf-8') df.head()

represent points consistently as (lat, lon)

coords = df.as_matrix(columns=['lat', 'lon'])

define epsilon as 1.5 kilometers, converted to radians for use by haversine

epsilon = 1.5 / kms_per_radian

start_time = time.time() db = DBSCAN(eps=epsilon, min_samples=1, algorithm='ball_tree', metric='haversine').fit(np.radians(coords)) cluster_labels = db.labels_

get the number of clusters

num_clusters = len(set(cluster_labels))enter image description here

all done, print the outcome

message = 'ClusteredI have CSV file in my code which contain following thing {:,} points down to {:lon,} clustersdate, for {:.1f}% compression in {:city,.2f} seconds'country print(message51.format(len(df), num_clusters4812916, 100*(1 - float(num_clusters) / len(df)), time.time()-start_time)) print('Silhouette coefficient: {:0.03f}'.format(metrics.silhouette_score(coords, cluster_labels)))

turn the clusters in to a pandas series, where each element is a cluster of points

clusters = pd.Series([coords[cluster_labels==n] for n in range(num_clusters)])

def get_centermost_point(cluster): centroid = (MultiPoint(cluster).centroid.x, MultiPoint(cluster).centroid.y) centermost_point = min(cluster, key=lambda point: great_circle(point, centroid).m) return tuple(centermost_point)

centermost_points = clusters.map(get_centermost_point)

unzip the list of centermost points (lat, lon) tuples into separate lat and lon lists

lats, lons = zip(*centermost_points)

from these lats/lons create a new df of one representative point for each cluster

rep_points = pd.DataFrame({'lon':lons, 'lat':lats}) rep_points.tail()

pull row from original data set where lat/lon match the lat/lon of each row of representative points

that way we get the full details like city, country, and date from the original dataframe

rs = rep_points.apply(lambda row: df[(df['lat']==row['lat']) & (df['lon']==row['lon'])].iloc[0]4510112, axis=1) rs.to_csv('data05/summer-travel-gps-dbscan.csv', encoding='utf-8') rs.tail()

plot the final reduced set of coordinate points vs the original full set

fig, ax = plt.subplots(figsize=[10, 6]) rs_scatter = ax.scatter(rs['lon'], rs['lat'], c='#99cc99', edgecolor='None', alpha=0.7, s=120) df_scatter = ax.scatter(df['lon'], df['lat'], c='k', alpha=0.9, s=3) ax.set_title('Full data set vs DBSCAN reduced set') ax.set_xlabel('Longitude') ax.set_ylabel('Latitude') ax.legend([df_scatter, rs_scatter], ['Full set'14/2014 09:07, 'Reduced set']West Drayton, loc='upper right') plt.show()United Kingdom

import pandas as pd, numpy as np, matplotlib.pyplot as plt, time from sklearn.cluster import DBSCAN from sklearn import metrics from geopy.distance import great_circle from shapely.geometry import MultiPoint

define the number of kilometers in one radian

kms_per_radian = 6371.0088

load the data set

df = pd.read_csv('data/summer-travel-gps-full.csv', encoding='utf-8') df.head()

represent points consistently as (lat, lon)

coords = df.as_matrix(columns=['lat', 'lon'])

define epsilon as 1.5 kilometers, converted to radians for use by haversine

epsilon = 1.5 / kms_per_radian

start_time = time.time() db = DBSCAN(eps=epsilon, min_samples=1, algorithm='ball_tree', metric='haversine').fit(np.radians(coords)) cluster_labels = db.labels_

get the number of clusters

num_clusters = len(set(cluster_labels))

all done, print the outcome

message = 'Clustered {:,} points down to {:,} clusters, for {:.1f}% compression in {:,.2f} seconds' print(message.format(len(df), num_clusters, 100*(1 - float(num_clusters) / len(df)), time.time()-start_time)) print('Silhouette coefficient: {:0.03f}'.format(metrics.silhouette_score(coords, cluster_labels)))

turn the clusters in to a pandas series, where each element is a cluster of points

clusters = pd.Series([coords[cluster_labels==n] for n in range(num_clusters)])

def get_centermost_point(cluster): centroid = (MultiPoint(cluster).centroid.x, MultiPoint(cluster).centroid.y) centermost_point = min(cluster, key=lambda point: great_circle(point, centroid).m) return tuple(centermost_point)

centermost_points = clusters.map(get_centermost_point)

unzip the list of centermost points (lat, lon) tuples into separate lat and lon lists

lats, lons = zip(*centermost_points)

from these lats/lons create a new df of one representative point for each cluster

rep_points = pd.DataFrame({'lon':lons, 'lat':lats}) rep_points.tail()

pull row from original data set where lat/lon match the lat/lon of each row of representative points

that way we get the full details like city, country, and date from the original dataframe

rs = rep_points.apply(lambda row: df[(df['lat']==row['lat']) & (df['lon']==row['lon'])].iloc[0], axis=1) rs.to_csv('data/summer-travel-gps-dbscan.csv', encoding='utf-8') rs.tail()

plot the final reduced set of coordinate points vs the original full set

fig, ax = plt.subplots(figsize=[10, 6]) rs_scatter = ax.scatter(rs['lon'], rs['lat'], c='#99cc99', edgecolor='None', alpha=0.7, s=120) df_scatter = ax.scatter(df['lon'], df['lat'], c='k', alpha=0.9, s=3) ax.set_title('Full data set vs DBSCAN reduced set') ax.set_xlabel('Longitude') ax.set_ylabel('Latitude') ax.legend([df_scatter, rs_scatter], ['Full set', 'Reduced set'], loc='upper right') plt.show()

enter image description here

I have CSV file in my code which contain following thing ,lon,date,city,country 51.4812916,-0.4510112,05/14/2014 09:07,West Drayton,United Kingdom

Included my code
Source Link
Viral
  • 21
  • 5

I have Latitude ,longitude and timestamp of image. I want to cluster these image according to detect events. For instance I went to Paris for 4 days then london 3 days and so on. So I want to detect cluster of Paris data and after london.I want each event to be seperated. How can I use this Latitude ,longitude and timestamp together to make cluster? I have done with DBSCAN algorithm but could note merge the time in it.Look at my code if it helps to understand problem.

import pandas as pd, numpy as np, matplotlib.pyplot as plt, time from sklearn.cluster import DBSCAN from sklearn import metrics from geopy.distance import great_circle from shapely.geometry import MultiPoint

define the number of kilometers in one radian

kms_per_radian = 6371.0088

load the data set

df = pd.read_csv('data/summer-travel-gps-full.csv', encoding='utf-8') df.head()

represent points consistently as (lat, lon)

coords = df.as_matrix(columns=['lat', 'lon'])

define epsilon as 1.5 kilometers, converted to radians for use by haversine

epsilon = 1.5 / kms_per_radian

start_time = time.time() db = DBSCAN(eps=epsilon, min_samples=1, algorithm='ball_tree', metric='haversine').fit(np.radians(coords)) cluster_labels = db.labels_

get the number of clusters

num_clusters = len(set(cluster_labels))

all done, print the outcome

message = 'Clustered {:,} points down to {:,} clusters, for {:.1f}% compression in {:,.2f} seconds' print(message.format(len(df), num_clusters, 100*(1 - float(num_clusters) / len(df)), time.time()-start_time)) print('Silhouette coefficient: {:0.03f}'.format(metrics.silhouette_score(coords, cluster_labels)))

turn the clusters in to a pandas series, where each element is a cluster of points

clusters = pd.Series([coords[cluster_labels==n] for n in range(num_clusters)])

def get_centermost_point(cluster): centroid = (MultiPoint(cluster).centroid.x, MultiPoint(cluster).centroid.y) centermost_point = min(cluster, key=lambda point: great_circle(point, centroid).m) return tuple(centermost_point)

centermost_points = clusters.map(get_centermost_point)

unzip the list of centermost points (lat, lon) tuples into separate lat and lon lists

lats, lons = zip(*centermost_points)

from these lats/lons create a new df of one representative point for each cluster

rep_points = pd.DataFrame({'lon':lons, 'lat':lats}) rep_points.tail()

pull row from original data set where lat/lon match the lat/lon of each row of representative points

that way we get the full details like city, country, and date from the original dataframe

rs = rep_points.apply(lambda row: df[(df['lat']==row['lat']) & (df['lon']==row['lon'])].iloc[0], axis=1) rs.to_csv('data/summer-travel-gps-dbscan.csv', encoding='utf-8') rs.tail()

plot the final reduced set of coordinate points vs the original full set

fig, ax = plt.subplots(figsize=[10, 6]) rs_scatter = ax.scatter(rs['lon'], rs['lat'], c='#99cc99', edgecolor='None', alpha=0.7, s=120) df_scatter = ax.scatter(df['lon'], df['lat'], c='k', alpha=0.9, s=3) ax.set_title('Full data set vs DBSCAN reduced set') ax.set_xlabel('Longitude') ax.set_ylabel('Latitude') ax.legend([df_scatter, rs_scatter], ['Full set', 'Reduced set'], loc='upper right') plt.show()
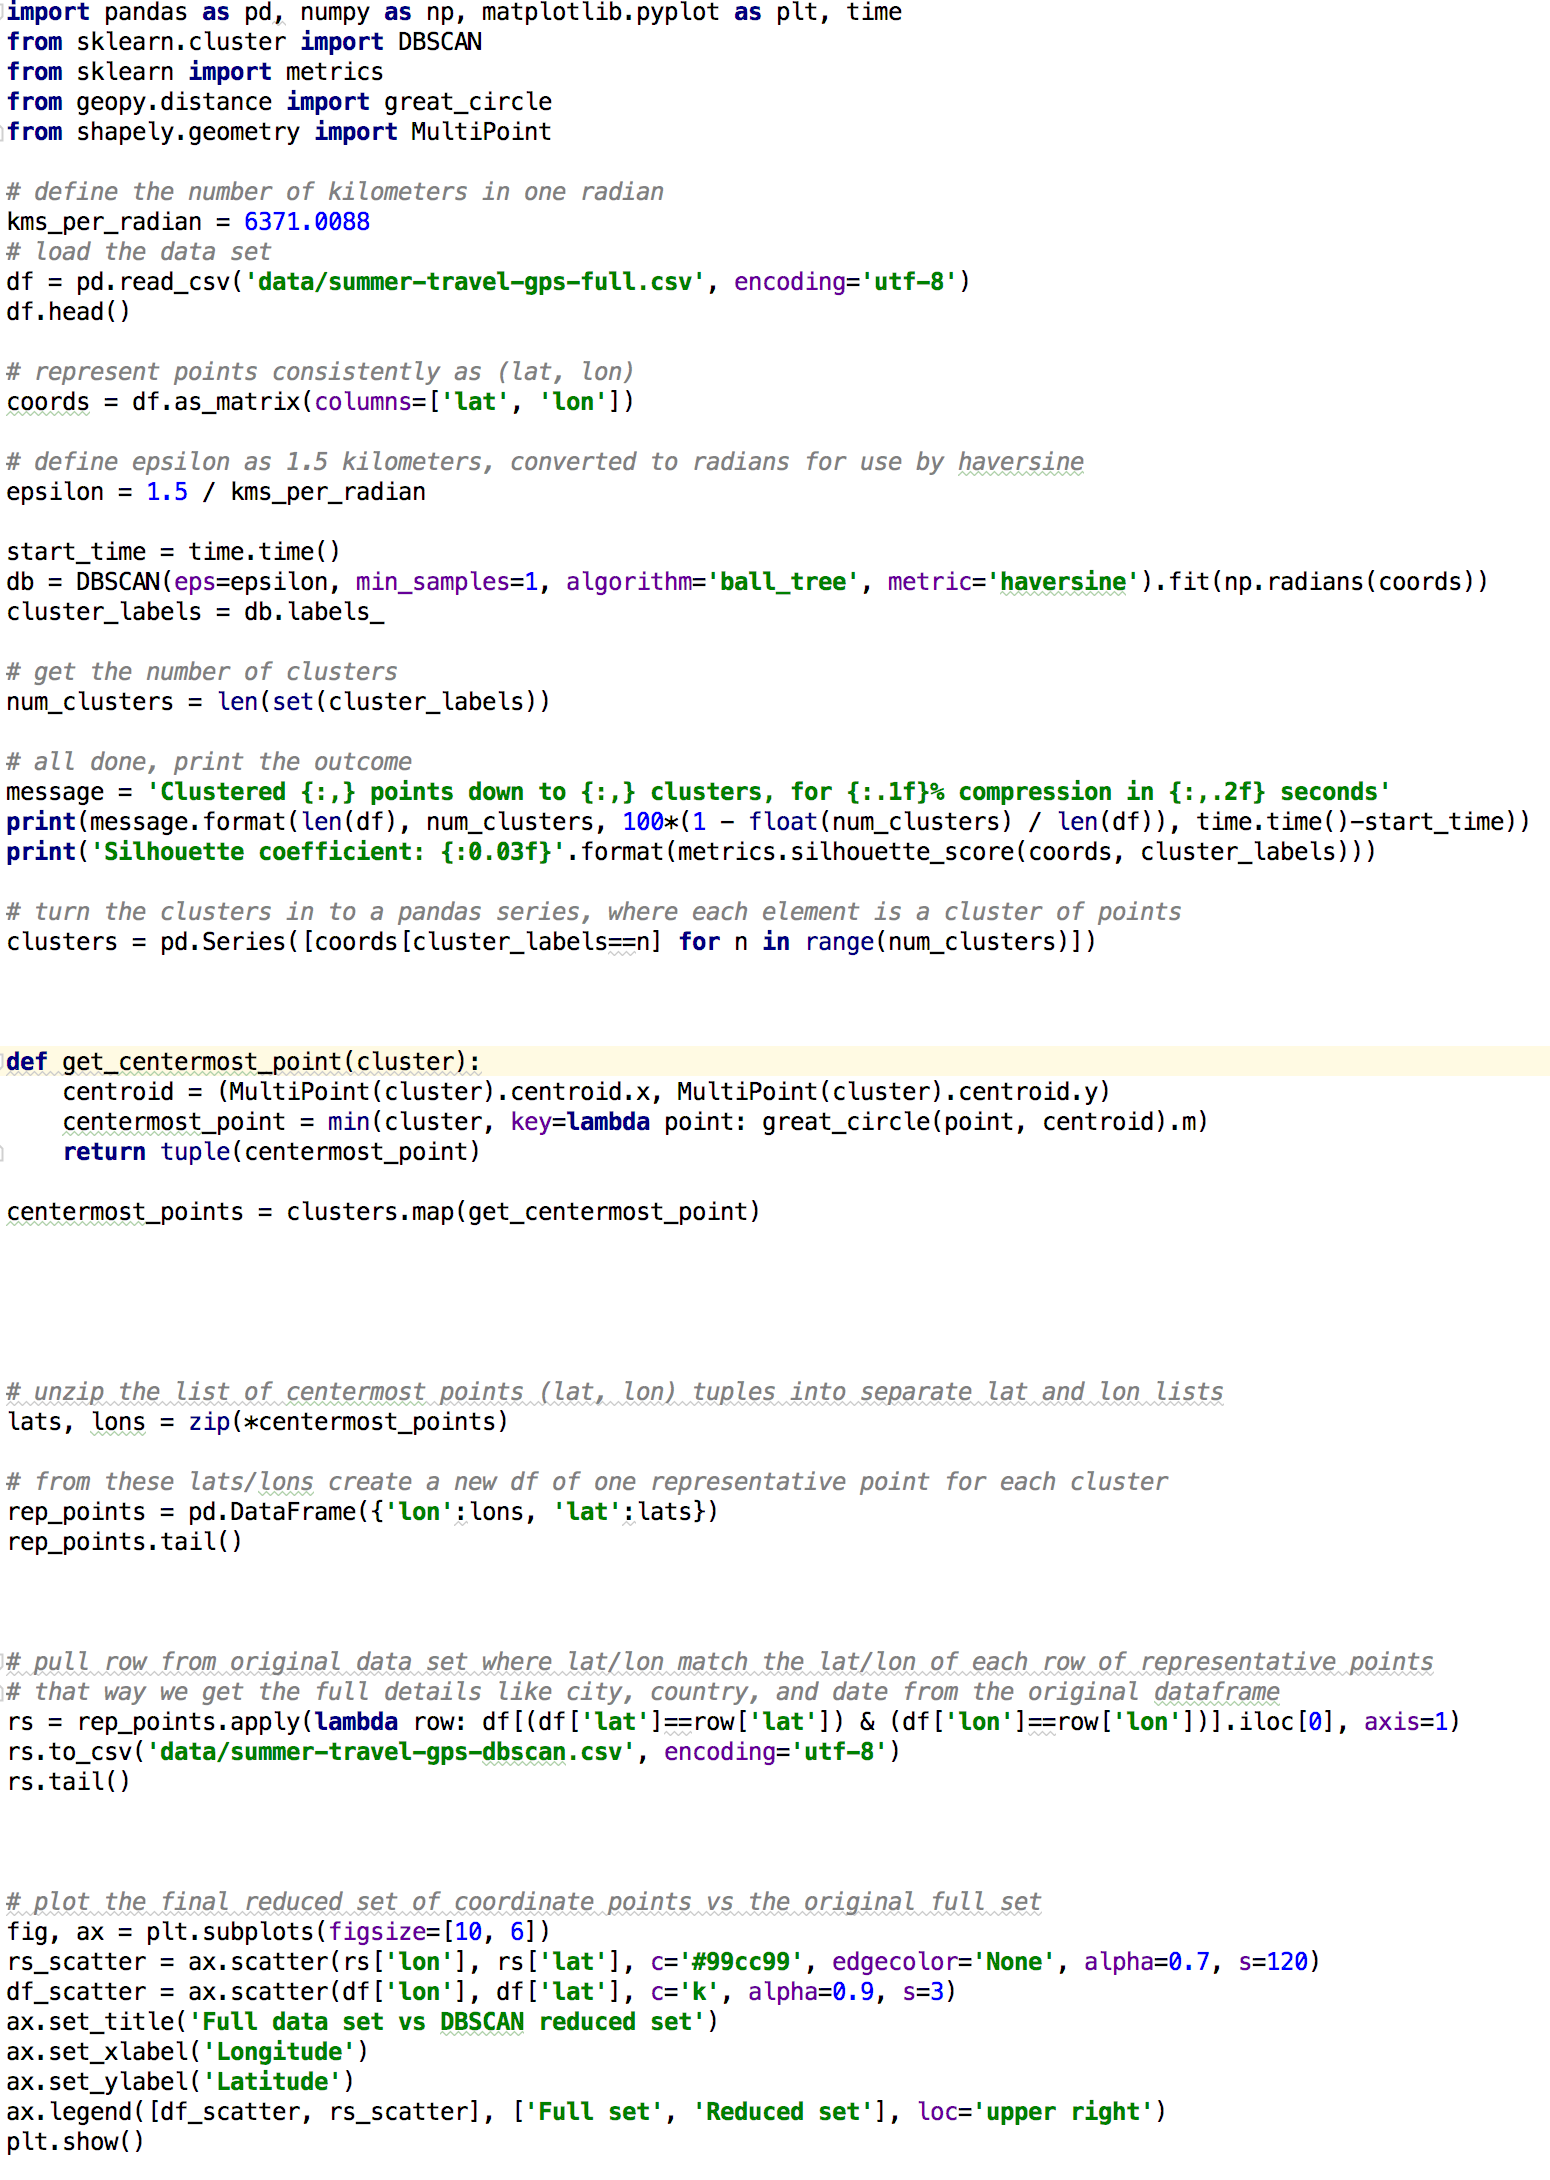
I have Latitude ,longitude and timestamp of image. I want to cluster these image according to detect events. For instance I went to Paris for 4 days then london 3 days and so on. So I want to detect cluster of Paris data and after london. How can I use this Latitude ,longitude and timestamp together to make cluster?

I have Latitude ,longitude and timestamp of image. I want to cluster these image according to detect events. For instance I went to Paris for 4 days then london 3 days and so on. So I want to detect cluster of Paris data and after london.I want each event to be seperated. How can I use this Latitude ,longitude and timestamp together to make cluster? I have done with DBSCAN algorithm but could note merge the time in it.Look at my code if it helps to understand problem.

import pandas as pd, numpy as np, matplotlib.pyplot as plt, time from sklearn.cluster import DBSCAN from sklearn import metrics from geopy.distance import great_circle from shapely.geometry import MultiPoint

define the number of kilometers in one radian

kms_per_radian = 6371.0088

load the data set

df = pd.read_csv('data/summer-travel-gps-full.csv', encoding='utf-8') df.head()

represent points consistently as (lat, lon)

coords = df.as_matrix(columns=['lat', 'lon'])

define epsilon as 1.5 kilometers, converted to radians for use by haversine

epsilon = 1.5 / kms_per_radian

start_time = time.time() db = DBSCAN(eps=epsilon, min_samples=1, algorithm='ball_tree', metric='haversine').fit(np.radians(coords)) cluster_labels = db.labels_

get the number of clusters

num_clusters = len(set(cluster_labels))

all done, print the outcome

message = 'Clustered {:,} points down to {:,} clusters, for {:.1f}% compression in {:,.2f} seconds' print(message.format(len(df), num_clusters, 100*(1 - float(num_clusters) / len(df)), time.time()-start_time)) print('Silhouette coefficient: {:0.03f}'.format(metrics.silhouette_score(coords, cluster_labels)))

turn the clusters in to a pandas series, where each element is a cluster of points

clusters = pd.Series([coords[cluster_labels==n] for n in range(num_clusters)])

def get_centermost_point(cluster): centroid = (MultiPoint(cluster).centroid.x, MultiPoint(cluster).centroid.y) centermost_point = min(cluster, key=lambda point: great_circle(point, centroid).m) return tuple(centermost_point)

centermost_points = clusters.map(get_centermost_point)

unzip the list of centermost points (lat, lon) tuples into separate lat and lon lists

lats, lons = zip(*centermost_points)

from these lats/lons create a new df of one representative point for each cluster

rep_points = pd.DataFrame({'lon':lons, 'lat':lats}) rep_points.tail()

pull row from original data set where lat/lon match the lat/lon of each row of representative points

that way we get the full details like city, country, and date from the original dataframe

rs = rep_points.apply(lambda row: df[(df['lat']==row['lat']) & (df['lon']==row['lon'])].iloc[0], axis=1) rs.to_csv('data/summer-travel-gps-dbscan.csv', encoding='utf-8') rs.tail()

plot the final reduced set of coordinate points vs the original full set

fig, ax = plt.subplots(figsize=[10, 6]) rs_scatter = ax.scatter(rs['lon'], rs['lat'], c='#99cc99', edgecolor='None', alpha=0.7, s=120) df_scatter = ax.scatter(df['lon'], df['lat'], c='k', alpha=0.9, s=3) ax.set_title('Full data set vs DBSCAN reduced set') ax.set_xlabel('Longitude') ax.set_ylabel('Latitude') ax.legend([df_scatter, rs_scatter], ['Full set', 'Reduced set'], loc='upper right') plt.show()

Source Link
Viral
  • 21
  • 5
Loading