deleted 4 characters in body; edited title
Source Link
Xi'an
  • 107.7k
  • 13
  • 190
  • 676

Mean vs. TruncatedTrimmed mean in the normal distribution

In a simple experiment with the normal distribution in R I ran 500 iterations of a simulated normal distribution with N=100 each. For each iteration from the 500 iterations, I calculated both the mean and the truncatedtrimmed mean with 20% trim (from each side), resulting in 500 values for each. Then, I compared the values of both with a boxplot: Boxplot (mean vs truncated mean)Boxplot (mean vs trimmed mean)
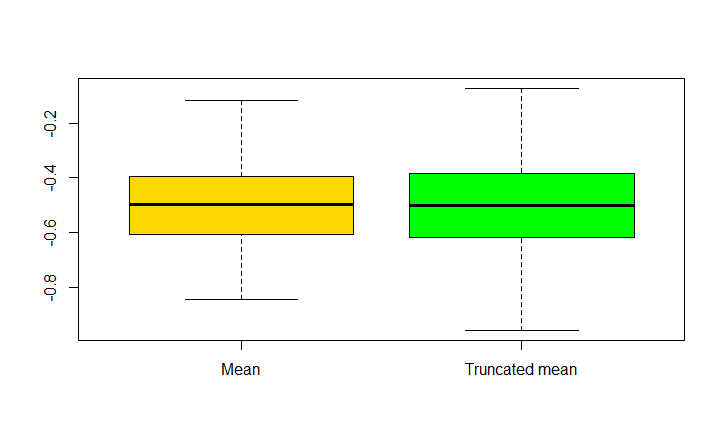
It seems that the mean values are more "precise". I have managed to reproduce these results in almost all tries, and in the tries that I couldn't, the boxplot resulted in a similar plot for each.

This feels a bit counter-intuitive. I expected for it to be the other way around, since the 20% trim will remove results with high deviation. The only explanation I was able to think of for this observation is that the trim removes data that would otherwise "balance" the mean, though, it's not a formal explanation.

Would love some insights on this observation, thanks!

Mean vs. Truncated mean in the normal distribution

In a simple experiment with the normal distribution in R I ran 500 iterations of a simulated normal distribution with N=100 each. For each iteration from the 500 iterations, I calculated both the mean and the truncated mean with 20% trim (from each side), resulting in 500 values for each. Then, I compared the values of both with a boxplot: Boxplot (mean vs truncated mean)

It seems that the mean values are more "precise". I have managed to reproduce these results in almost all tries, and in the tries that I couldn't, the boxplot resulted in a similar plot for each.

This feels a bit counter-intuitive. I expected for it to be the other way around, since the 20% trim will remove results with high deviation. The only explanation I was able to think of for this observation is that the trim removes data that would otherwise "balance" the mean, though, it's not a formal explanation.

Would love some insights on this observation, thanks!

Mean vs. Trimmed mean in the normal distribution

In a simple experiment with the normal distribution in R I ran 500 iterations of a simulated normal distribution with N=100 each. For each iteration from the 500 iterations, I calculated both the mean and the trimmed mean with 20% trim (from each side), resulting in 500 values for each. Then, I compared the values of both with a boxplot: Boxplot (mean vs trimmed mean)

It seems that the mean values are more "precise". I have managed to reproduce these results in almost all tries, and in the tries that I couldn't, the boxplot resulted in a similar plot for each.

This feels a bit counter-intuitive. I expected for it to be the other way around, since the 20% trim will remove results with high deviation. The only explanation I was able to think of for this observation is that the trim removes data that would otherwise "balance" the mean, though, it's not a formal explanation.

Would love some insights on this observation, thanks!

Tweeted twitter.com/StackStats/status/927109817935843328
Source Link
Mickey
  • 213
  • 2
  • 5

Mean vs. Truncated mean in the normal distribution

In a simple experiment with the normal distribution in R I ran 500 iterations of a simulated normal distribution with N=100 each. For each iteration from the 500 iterations, I calculated both the mean and the truncated mean with 20% trim (from each side), resulting in 500 values for each. Then, I compared the values of both with a boxplot: Boxplot (mean vs truncated mean)

It seems that the mean values are more "precise". I have managed to reproduce these results in almost all tries, and in the tries that I couldn't, the boxplot resulted in a similar plot for each.

This feels a bit counter-intuitive. I expected for it to be the other way around, since the 20% trim will remove results with high deviation. The only explanation I was able to think of for this observation is that the trim removes data that would otherwise "balance" the mean, though, it's not a formal explanation.

Would love some insights on this observation, thanks!