Added image.
Source Link
cod3min3
  • 173
  • 1
  • 6

I have an interview soon for a graduate position. I will to do 10-15 presentation. So, I was sent out a regression plot by the recruiter and I have to present how I can make the regression plot more engaging and insightful to the end user.

The regression plot looks simple enough, it's black and white, has straight line and few points plotted. It looks like a plot of house area to housing areas against housing prices. One thing I did notice about the plot is that none of the axis have been named.

So how would I go about making this plot more insightful and engaging to an end user. One thing that I know is a must is to label the axis. Other things I could do is stating what the icons in the plot mean, showing the R (the multiple correlation coefficient), R squared (the coefficient of determination), adjusted R-squared and standard error of the estimate values.

What else could I do?

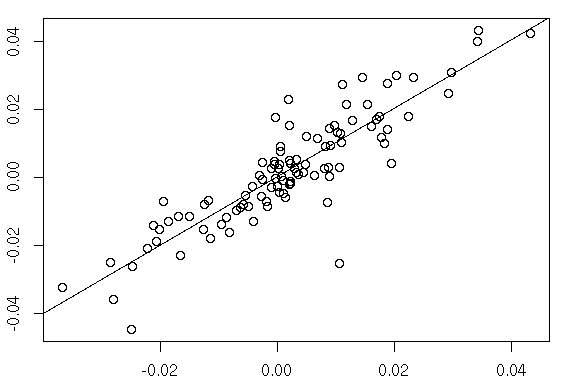
Edit: Here is an example of what the plot looks like. Regression plot

I have an interview soon for a graduate position. I will to do 10-15 presentation. So, I was sent out a regression plot by the recruiter and I have to present how I can make the regression plot more engaging and insightful to the end user.

The regression plot looks simple enough, it's black and white, has straight line and few points plotted. It looks like a plot of house area to housing prices. One thing I did notice about the plot is that none of the axis have been named.

So how would I go about making this plot more insightful and engaging to an end user. One thing that I know is a must is to label the axis. Other things I could do is stating what the icons in the plot mean, showing the R (the multiple correlation coefficient), R squared (the coefficient of determination), adjusted R-squared and standard error of the estimate values.

What else could I do?
I have an interview soon for a graduate position. I will to do 10-15 presentation. So, I was sent out a regression plot by the recruiter and I have to present how I can make the regression plot more engaging and insightful to the end user.

The regression plot looks simple enough, it's black and white, has straight line and few points plotted. It looks like a plot of housing areas against housing prices. One thing I did notice about the plot is that none of the axis have been named.

So how would I go about making this plot more insightful and engaging to an end user. One thing that I know is a must is to label the axis. Other things I could do is stating what the icons in the plot mean, showing the R (the multiple correlation coefficient), R squared (the coefficient of determination), adjusted R-squared and standard error of the estimate values.

What else could I do?

Edit: Here is an example of what the plot looks like. Regression plot

added tag
Link
user78229
  • 10.9k
  • 2
  • 25
  • 46
Source Link
cod3min3
  • 173
  • 1
  • 6

How to make a regression plot more insightful and engaging to an end user

I have an interview soon for a graduate position. I will to do 10-15 presentation. So, I was sent out a regression plot by the recruiter and I have to present how I can make the regression plot more engaging and insightful to the end user.

The regression plot looks simple enough, it's black and white, has straight line and few points plotted. It looks like a plot of house area to housing prices. One thing I did notice about the plot is that none of the axis have been named.

So how would I go about making this plot more insightful and engaging to an end user. One thing that I know is a must is to label the axis. Other things I could do is stating what the icons in the plot mean, showing the R (the multiple correlation coefficient), R squared (the coefficient of determination), adjusted R-squared and standard error of the estimate values.

What else could I do?