deleted 39 characters in body; edited tags
Source Link
Ferdi
  • 5.3k
  • 10
  • 47
  • 64

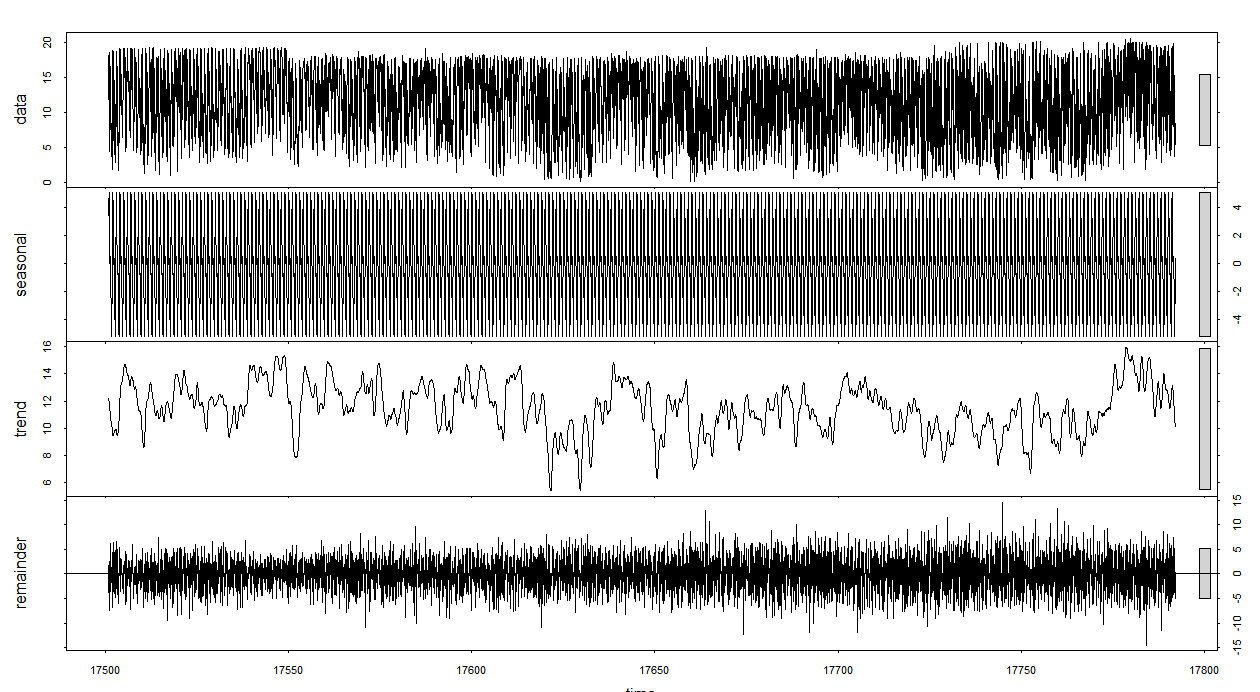
I have the below stl() (with s.window="periodic") decomposition plot of a time series which I would like to analyse and model. The time series is hourly with data from Dec 2017 up until 17 Sep 2018. I am not very sure on how to interpret the trend. Does it mean that my data has no overall trend? What does the "wiggly" trend line ,like so, indicate?

stl_decomp

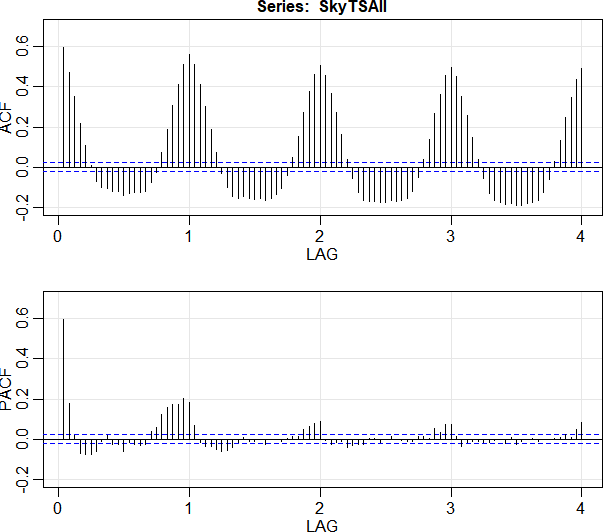
Apart from this, I plotted the ACF and the PACF plots for the series (without differencing or transforming) and I have the below plot and I cannot seem to understand what the the ACF plot is telling me.

acf_plot

Any help on this is much appreciated!
I have the below stl() (with s.window="periodic") decomposition plot of a time series which I would like to analyse and model. The time series is hourly with data from Dec 2017 up until 17 Sep 2018. I am not very sure on how to interpret the trend. Does it mean that my data has no overall trend? What does the "wiggly" trend line ,like so, indicate?

stl_decomp

Apart from this, I plotted the ACF and the PACF plots for the series (without differencing or transforming) and I have the below plot and I cannot seem to understand what the the ACF plot is telling me.

acf_plot

corrected missing comma
Source Link
Chaos
  • 113
  • 1
  • 3
  • 14

I have the below stl() (with s.window="periodic") decomposition plot of a time series which I would like to analyse and model. The time series is hourly with data from Dec 2017 up until 17 Sep 2018. I am not very sure on how to interpret the trend. Does it mean that my data has no overall trend? What does the "wiggly" trend line like,like so, indicate?

stl_decomp

Apart from this, I plotted the ACF and the PACF plots for the series (without differencing or transforming) and I have the below plot and I cannot seem to understand what the the ACF plot is telling me.

acf_plot

Any help on this is much appreciated!

I have the below stl() (with s.window="periodic") decomposition plot of a time series which I would like to analyse and model. The time series is hourly with data from Dec 2017 up until 17 Sep 2018. I am not very sure on how to interpret the trend. Does it mean that my data has no overall trend? What does the "wiggly" trend line like so, indicate?

stl_decomp

Apart from this, I plotted the ACF and the PACF plots for the series (without differencing or transforming) and I have the below plot and I cannot seem to understand what the the ACF plot is telling me.

acf_plot

Any help on this is much appreciated!

I have the below stl() (with s.window="periodic") decomposition plot of a time series which I would like to analyse and model. The time series is hourly with data from Dec 2017 up until 17 Sep 2018. I am not very sure on how to interpret the trend. Does it mean that my data has no overall trend? What does the "wiggly" trend line ,like so, indicate?

stl_decomp

Apart from this, I plotted the ACF and the PACF plots for the series (without differencing or transforming) and I have the below plot and I cannot seem to understand what the the ACF plot is telling me.

acf_plot

Any help on this is much appreciated!

Source Link
Chaos
  • 113
  • 1
  • 3
  • 14

Decomposition of seasonal time series interpretation

I have the below stl() (with s.window="periodic") decomposition plot of a time series which I would like to analyse and model. The time series is hourly with data from Dec 2017 up until 17 Sep 2018. I am not very sure on how to interpret the trend. Does it mean that my data has no overall trend? What does the "wiggly" trend line like so, indicate?

stl_decomp

Apart from this, I plotted the ACF and the PACF plots for the series (without differencing or transforming) and I have the below plot and I cannot seem to understand what the the ACF plot is telling me.

acf_plot

Any help on this is much appreciated!