Modelling is not about selecting a priori a specific type of equation BUT rather extracting the model specifics from the data in an iterative manner as presented here https://autobox.com/pdfs/ARIMA%20FLOW%20CHART.pdf in order to optimally/opportunistically combine linear, exponential smoothing and arima components while dealing with latent deterministic structure such as pulses , level/step shifts,local time trends and/or seasonal pulses AND possible transience in either model parameters or model error variance through time.
The whole idea is to use Exploratory Data Analysis tools (EDA) to evolve/deterimine the underlying model in order to separate signal and noise via an iterative self-checking approach as originally presented by Box & Jenkins and improved since.
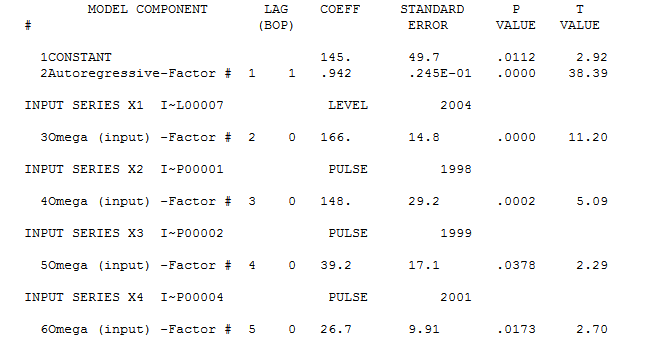
In your first example the deterministic structure required is a level shift (intercept change) and a few pulses with an arima (1,0,0) nearly (0,1,0) while the second example it is simply two pulses with an arima (0,1,0) .
first example:
There is a very clear pattern in the data as shown here 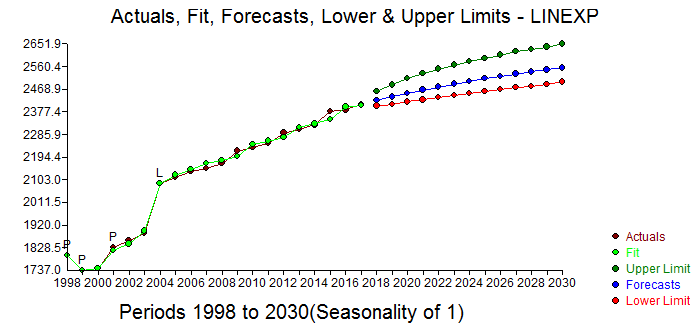 . Your 20 values are adequately described by a hybrid model using an AR(1) and a step/level shift along with 3 pulses .
  and here
  and here
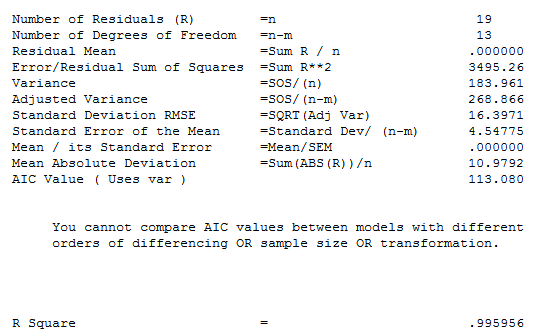
The tools (approaches) that you were considering are presumptive in form whereas your data has it's own message. This data has not only a strong memory but has been affected by external activity causing the step.level shift and the 3 pulses.
here are the forecasts for the next 13 periods 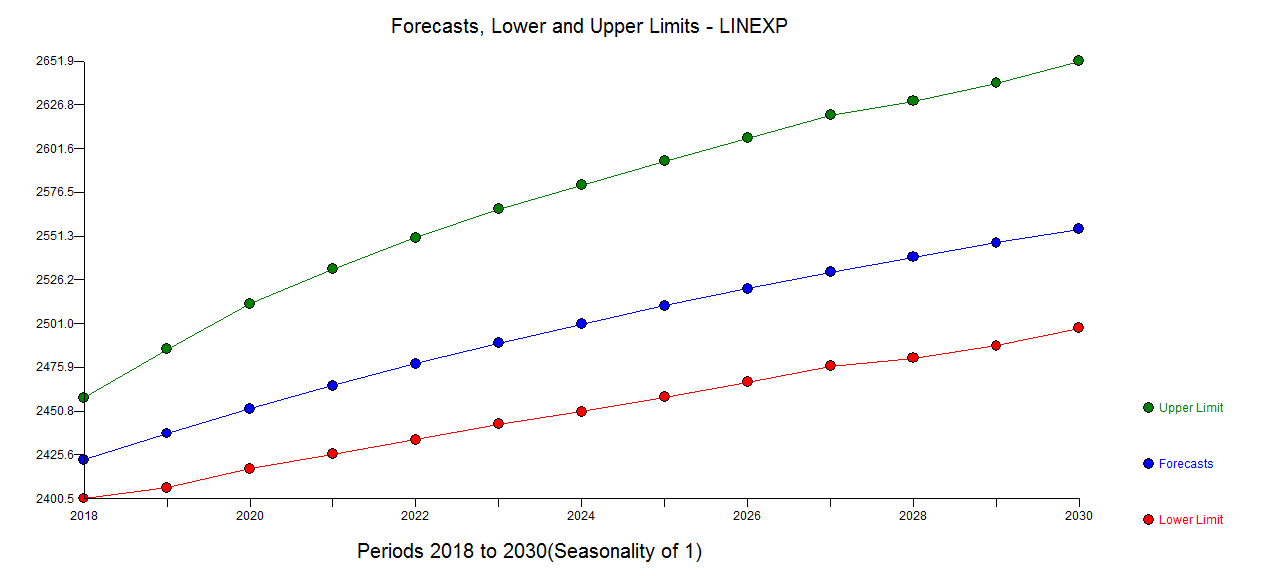
The method used here to form the model is called Intervention Detection as detailed here and everywhere else http://docplayer.net/12080848-Outliers-level-shifts-and-variance-changes-in-time-series.html . Search SE for "INTERVENTION DETECTION" . It might behoove you to investigate the true cause of the level/step shift in order to more intelligently forecast this series.
Here is the Actual and Cleansed plot 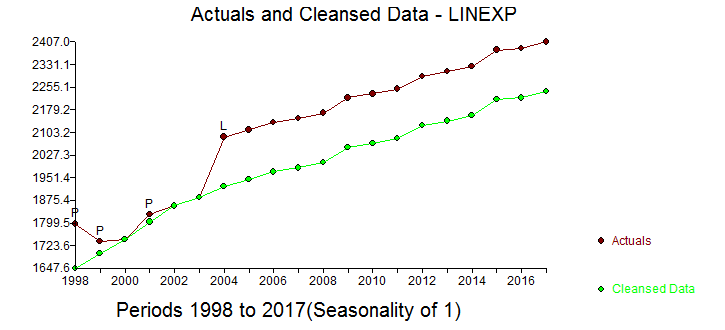
The reason that arima (memory) doesn't work (alone) is that there is determinstic structure in the data .
second example:
This is also a hybrid model arima (1,1,0) with two pulses reflecting external deterministic inputs. The Actual/Fit and Forecast is here 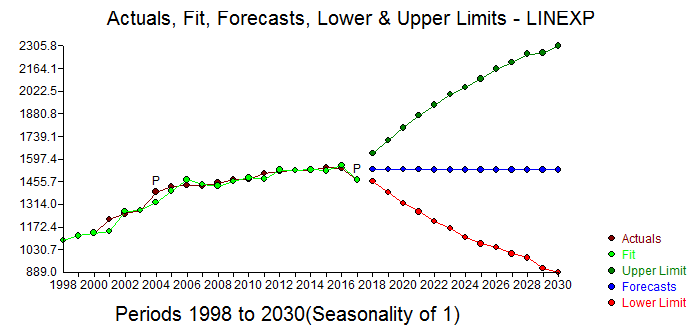 with equation here
  and here
 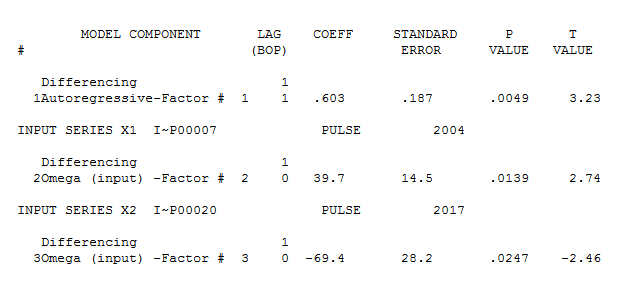 with statistical summary here
 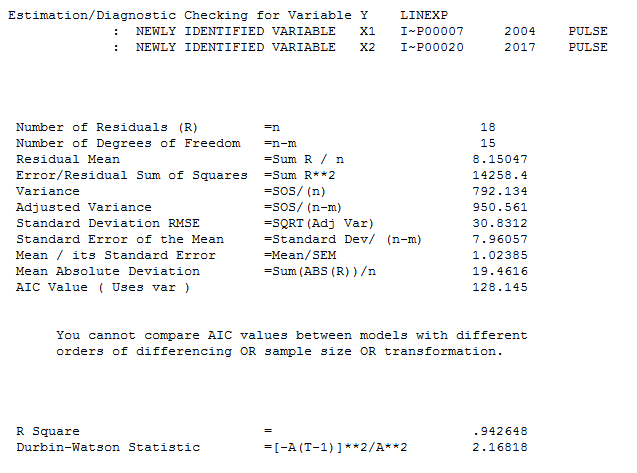 and for
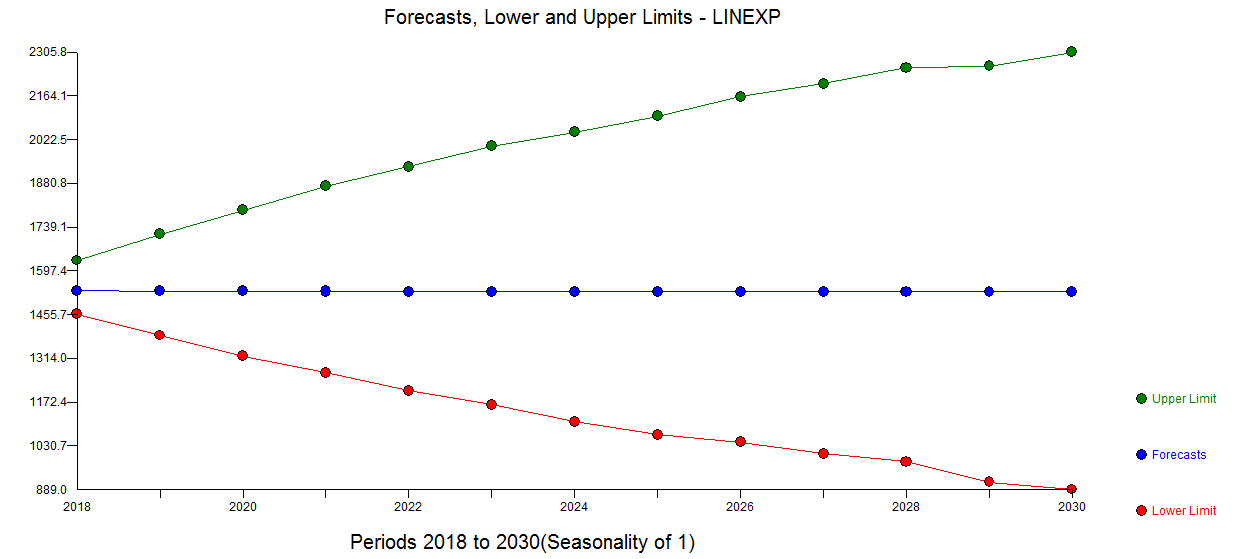 ecasts here . The Actual and cleansed graph is here
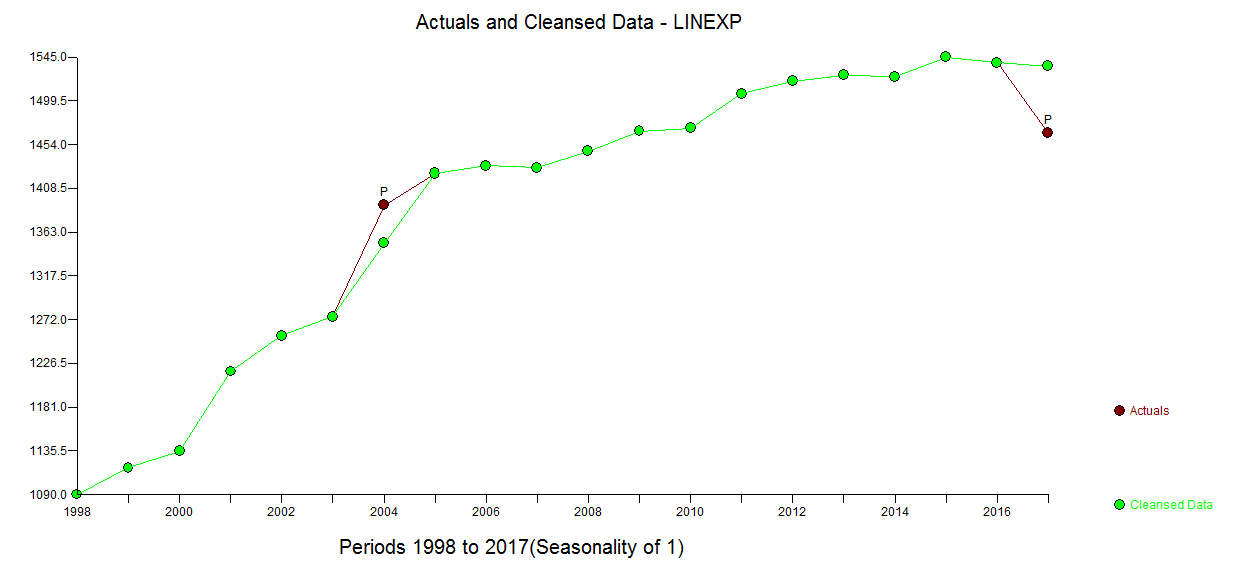
It is critical to assess whether the anomaly (pulse) downwards at the last point is "real and to be believed" or "a temporary change" . If it is temporary then the forecasts given are to be used , however if it is permanent then subtract 69.4 for each forecast period.
I used AUTOBOX an integrated piece of software that I have helped to develop but there a number of alternative software tools that can be cobbled together to give similar results as to the ideas that I have presented.
